
Where is the Economy Heading?
Weekly Market Review from the
weekending February, 17th 2023

The content of this Newsletter is to provide you with Economic insights to assist you in making better decisions with your investments. Unlike many other financial periodicals we will not mention specific companies, unless it is relevant to an overall economic issue. We welcome your questions on economic concerns and will address in our newsletter. just email us at info@optfinancialstrategies.com #FinancialAdvisor,#investmentmanagement #wealthmanagement #financialplanning #retirementplanning #401kplans
Week In Review
It seems like the data on inflation is a bit more challenging to wrangle than expected. Last week’s information saw an uptick in monthly inflation data versus December and concerns about higher interest rates left U.S. equities mixed for the week. The DOW and the S&P were down slightly for the week -.13% and -.28% respectively. The Russell 2000 and the NASDAQ both edged into positive territory with +1.44% and +.59% price returns.
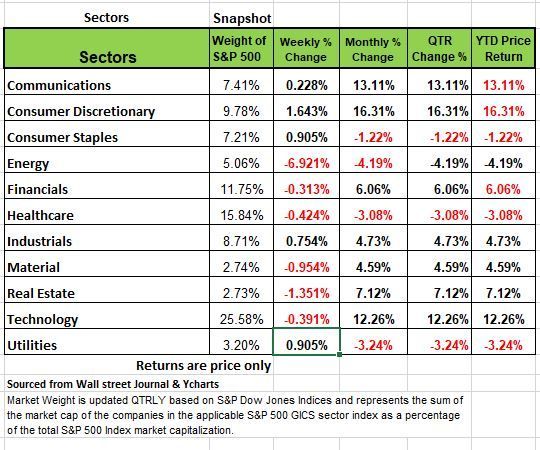
Six of 11 S&P500 sectors retreated, with energy diving -6% as a rising U.S. dollar sent crude oil prices tumbling to $75 per barrel. Consumer Discretionary saw a 1.64% increase last week which in part came from January retail sales increasing 3% in January showing that consumers seem to be resilient to higher prices. However consumer debt reached a new high at the end of 2022 as we continue to see a rise in delinquencies.
U.S. CPI rose 0.5% MoM in January, while producer prices jumped 0.7%, both above estimates. Yearly increases came in lower from the prior month, just not at the pace that the Fed and consumers would like to see.
February’s manufacturing activity slumped in the Philadelphia region, falling to May 2020 levels as new orders sank and prices paid increased. Slightly lower mortgage rates stoked a pick-up in homebuyer demand in early February, sending the NAHB Housing Index to its highest reading since September.
Still, sentiment stands far below last year’s peak and housing starts decreased 4.5% in January as new construction stalled.
Internationally, Eurozone Q4 GDP managed to stay in positive territory on the second estimate, and the European Commission upped its growth forecast to 0.9% for 2023 from the prior 0.3% in November. In the UK, annual CPI slowed to +10.1% in January, down from October’s high of 11.1% but still exacting a huge toll on British households. Their retail sales rose slightly in January, but the demand outlook remained weak.
Australia’s consumer sentiment soured in February as the jobless rate jumped and the prospect of further interest rate hikes loomed. And finally, Japan’s economy narrowly averted a recession in Q4 2022, expanding much less than expected at 0.6%. The next BOJ governor nominee, Kazuo Ueda, faces challenges normalizing the central bank’s ultra-loose policy, and his background suggests no sudden changes are likely.

Last week’s economic reports were widely anticipated and included multiple readings on inflation. At the beginning of the month the 10-year treasury with a coupon of 4.125% was yielding 3.52% investors were willing to pay a premium for the bond which drove the yield down. At auction the coupon on the 10 year dropped to 3.5% and now the bond is selling at a discount to drive up yields. Which we saw last week with the 10 yr. Treasury ending the week with 3.82%. Last year the fixed income market took as much a beating as the equities leaving investors with few places to hide.
In his December Press Conference, Chairman Powell noted that “The inflation data received so far for October and November show a welcome reduction in the monthly pace of price increases.”
The Fed’s indicated willingness to be ‘data dependent’ on inflation readings has the market particularly sensitive to reporting on inflation reports. January’s CPI was reported last Tuesday and matched expectations of a 0.5% increase and up 6.4% year-over-year. This report continued a trend of falling inflation, albeit “core” remains elevated relative to falling goods inflation. Friday saw the Producer Price Index information from January release which was elevated relative to expectations and up 6% from the prior year. Taken together, the week saw higher yields across the curve with a 4% coupon being attained by the 5 Yr. T-Note.
Where the Economy Heading
You can’t read or watch financial news these days without a heavy dose of speculation about what the Fed is going to do with short-term interest rates, when it’s going to do it, and how long it’s going to do it.
But we feel it is important to note that we no longer live in an era of real journalism, especially in the financial media, it more of a world of sensationalism driven by an agenda to get the investors to overreact on both side of the equation.
It seems like half of the economist have a pessimistic view of the economy while the other half seem to have an optimistic view. As we look at the Leading indicators we think that they continue to point toward more economic weakness, making it difficult and premature to determine whether the labor market can maintain its relative strength. But we use the word strength with hesitance since the numbers appears to be manipulated a bit and inaccurate.
A recession of the "rolling" variety has been underway for some time. The growth surge coming out of COVID lockdowns benefitted the goods side of the economy, courtesy of massive government handout. That situation which caused global supply issues became the breeding ground for the inflation problem we are experiencing today.
However, the goods side of both the economy and inflation statistics have decelerated sharply, giving way to the demand surge for services, which has boosted that side of inflation data.
It seems like the appropriate debate between economist is not so much a hard landing recession vs. soft landing, but how long a rolling recession can continue without provoking a formal declaration from the National Bureau of Economic Research (NBER) that a recession is here or was here?
We think that the best-case scenario is one of an ongoing roll of weakness through the economy, with offsetting pockets of strength.
October 2022 low, the S&P 500 had already suffered a -25% bear market decline. That's not to say there isn't some more downside and/or volatility ahead; just that as a leading indicator, stocks tend to anticipate both economic contractions as well as recoveries. But the Bond markets tend to be a bit more accurate, and they are not looking too positive right now.
The Leading Economic Index (LEI), published monthly by The Conference Board, has been in a rapid descent over the past 10 months. As shown below, it's fallen to a reading only seen historically during recessions that were already underway. The stock market is one leading indicator, with the S&P 500 representing one of the 10 components of the LEI. The rest are listed in the chart below.
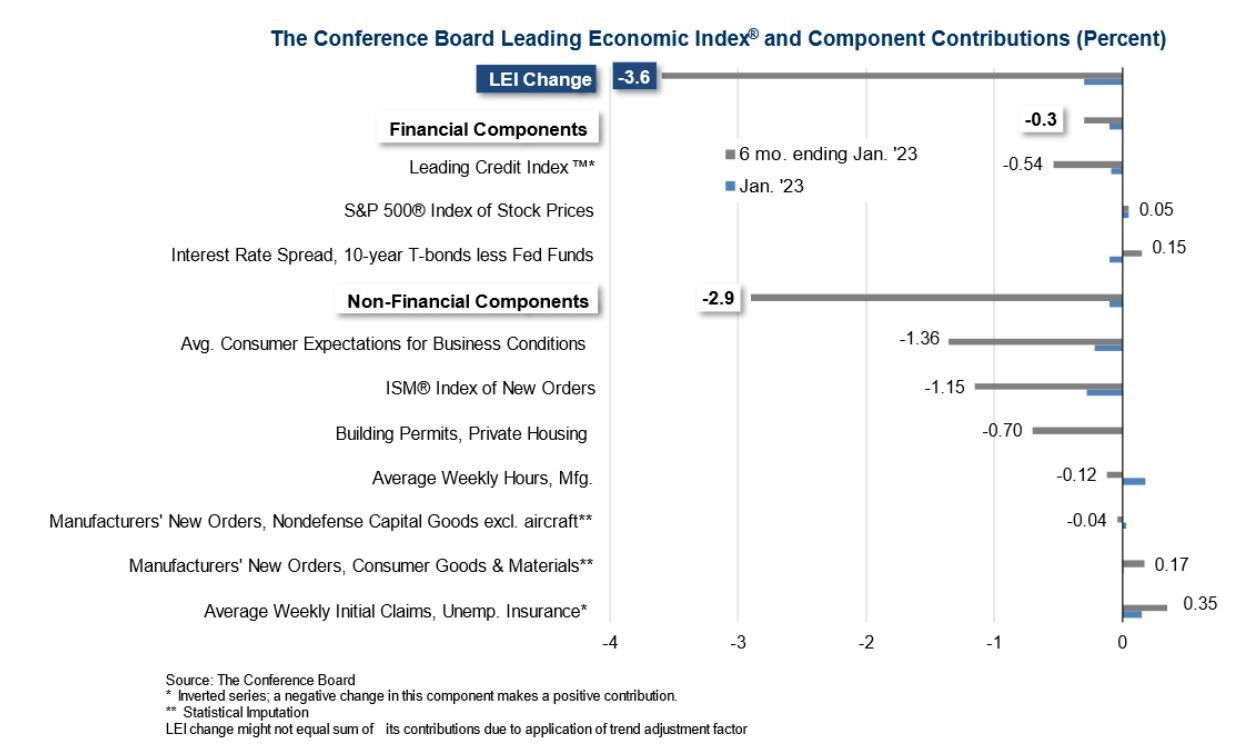
Another LEI component is initial unemployment claims, which surprised many last week, when claims had fallen back below 200k. But the continuous claims are rising because workers are not able to find new jobs aa easily. At the recent peak in continuing claims, they were up more than 30% from the trough, which is well above the 19% increase that typically represents the average heading into recessions (based on numbers since the late-1960s.)
What seems to be unique in this COVID cycle is that the high inflation had driven strong top-line (revenue) growth for many companies, which in turn has helped keep initial claims low and payroll growth relatively stable. We also believe that labor "hoarding" is keeping claims low, from fear of finding workers if the demand shift again, However we see a significant deterioration in hours worked suggesting a weakening environment. The increase in rates is causing more financial trouble for some larger poorly run companies and we believe that there will be a point when they will need to run a more leaner ship and that is when claims are expected to increase
The Treasury yield spread is another component of the LEI. As shown below, the spread between 10-year and three-month yields is in deep negative territory. If a recession is avoided, it would be the first time in modern history that the curve was this inverted without one.
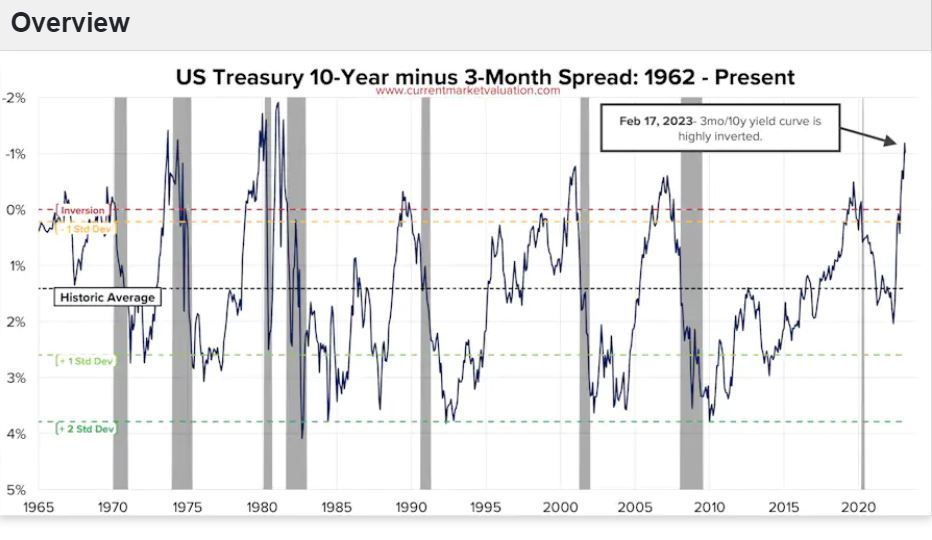
The severity of the inversion sits behind the spike in the New York Federal Reserve's recession probability model. At less than 50%, without historical context, that might not appear alarming; but, it has never jumped this high other than during recessions that were already underway.
Retail sales are a coincident indicator and for the month of December reported last week. They were significantly weaker than expected with downward revisions to prior readings. Nominal sales fell more than 1% with prior months revised down an additional (cumulative) 0.6%. Adjusting for December's deflation in goods, real retail sales showed no growth month-over-month. While the year-over-year change in retail sales remains positive, and above the historical trend, the six-month annualized change has descended into negative territory.
A flourishing theme has been that rising inflation/prices and consumers' willingness to pay them are concealing increasingly sluggish unit demand. As such, retail inventories ex-autos remain well above the pre-COVID trend, suggesting more discounting, and profit margin pressures, to come.
Manufacturing is another area in which recession signals are abundant. Specifically, manufacturing sentiment has been faltering for a good portion of the past year. Further declines shouldn't come as a surprise given the "heads up" nature of surveys like the ISM Manufacturing Index, which remain in contraction (<50) territory.
Building permits and home sales are one of the major LEI’s. Activity-based leading indicators like housing starts and building permits have also fallen noticeably from their respective peaks. In fact, the year-over-year decline in housing starts is at its worst (-22%) since April 2020; the decline in permits is at its worst (-30%) since July 2009.
Existing home sales are now down 38% from their high about a year ago—clearly recessionary. Adding fuel to that fire was the announcement last week by KB Homes, one of the nation's largest home builders, of a 68% cancel rate. That is significant to have more than two-thirds of homebuyers walked away from their contracts in the latest quarter. Assuming that statistic is neither a fluke nor specific to only one company, it suggests a troubling inventory pileup.
The rapid deterioration in the housing market is unquestionably a feature of what the Fed is trying to do in its quest to quell inflation. But the problem is that when homes become unaffordable and demand for housing is still high rents tend to increase and since the fed using rent as a larger part of the calculation of inflation it may just add fuel to the inflation problem.
Given "long and variable lags" between monetary policy and their impact on the economy, we have not yet felt the full impact of the aggressive hiking cycle. If we eventually see a stabilization (and subsequent upturn) in housing-related data without a commensurate decline in leading labor market data, a formal recession might be avoidable.
However, given the numerous recessionary signals from other leading indicators, we still think it's premature to assume that labor can make it out of this tightening cycle unscathed. Source Liz Ann Sonders Charles Schwab.
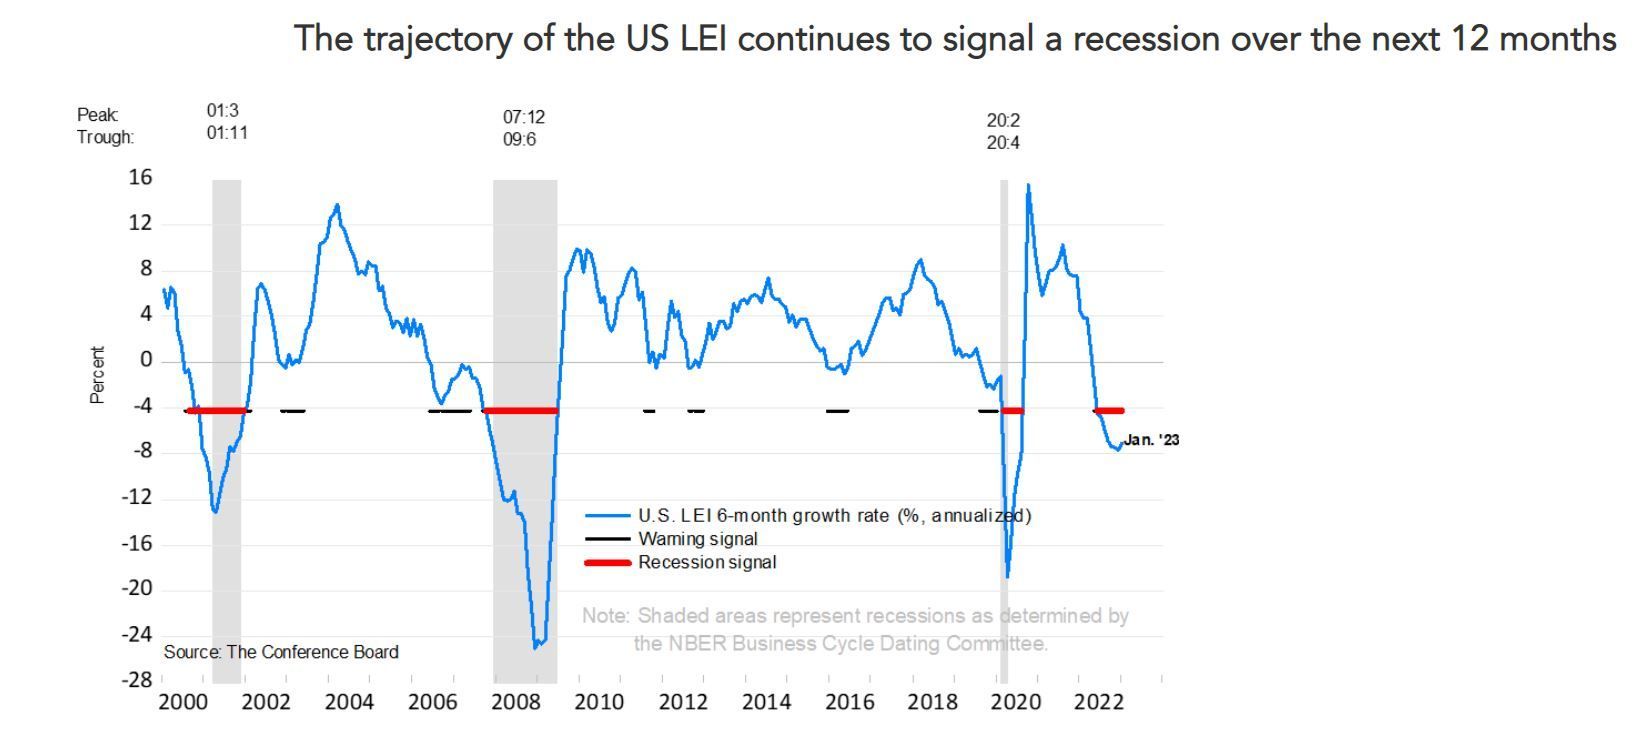
Trajectory of the LEI's
The chart Below illustrates the so-called 3D’s rule which is a reliable rule of thumb to interpret the duration, depth, and diffusion – the 3D’s – of a downward movement in the LEI. Duration refers to how long-lasting a decline in the index is, and depth denotes how large the decline is. Duration and depth are measured by the rate of change of the index over the last six months. Diffusion is a measure of how widespread the decline is (i.e., the diffusion index of the LEI ranges from 0 to 100 and numbers below 50 indicate most of the components are weakening). The 3D’s rule provides signals of impending recessions 1) when the diffusion index falls below the threshold of 50 (denoted by the black dotted line in the chart), and simultaneously 2) when the decline in the index over the most recent six months falls below the threshold of -4.2 percent. The red dotted line is drawn at the threshold value (measured by the median, -4.2 percent) on the months when both criteria are met simultaneously. The red dots signal a recession!
A Technical Perspective
For those new readers to our newsletter technical analysis is an investment strategy /trading discipline that relies on identifying opportunities by analyzing statistical trends gathered from trading activity, such as price movement and volume. While no one can identify the bottom and peak price of a security, technical analysis tries to identify opportunities close to it.
The technical condition of the market was little changed this week as the major averages finished the period mixed. The technical indicators slipped back into neutral to negative territory with MACD, a short-term trend gauge, crossing into bearish ground, while Momentum, as measured by the 14-day RSI, is neutral, but slowing. On a positive note, the major averages remain above key MA support levels keeping the uptrend intact. The DJIA struggled to stay above its 50-day MA before Friday's bounce, while the S&P 500 was unable to hold support at 4100. Another positive was the outperformance of the NASDAQ, Russell 2000 and DJ Transportation Index which all closed higher. Unfortunately, the different bullish breakout patterns mentioned over the last two weeks have mostly failed. At this stage the major averages look to be at a pivot point dependent on yields. That could keep the major averages range bound over the near-term.
The Week Ahead
A busy week lies ahead of the short market week due to the holiday, starting with Tuesday’s release of global flash PMI figures. In the U.S., investors will focus on Wednesday’s FOMC minutes, Friday’s Core PCE Price Index, and a few key earnings reports sprinkled throughout the week. Comments last week from two non-voting FOMC members rattled equity markets, so the minutes from the Fed’s last meeting will be scrutinized to see if any other members favored a larger rate hike. The recent sharp fall in the Fed’s preferred inflation indicator, from 5.2% in September to 4.4% in December, has buoyed the disinflation narrative. But another significant reduction may be hard pressed given January’s blockbuster jobs report and strong economic data. Earnings results from major retailers Walmart and Home Depot, along with technology bellwether Nvidia, will test the strength of this year’s stock rally. Other U.S. events of note include the second reading of Q4 GDP, new home sales, and personal income and spending numbers. Consumer inflation in Japan and Canada highlight the international calendar, along with economic sentiment releases in the Eurozone
This article is provided by Gene Witt of FourStar Wealth Advisors, LLC (“FourStar” or the “Firm”) for general informational purposes only. This information is not considered to be an offer to buy or sell any securities or investments. Investing involves the risk of loss and investors should be prepared to bear potential losses. Investments should only be made after thorough review with your investment advisor, considering all factors including personal goals, needs and risk tolerance. FourStar is a SEC registered investment adviser that maintains a principal place of business in the State of Illinois. The Firm may only transact business in those states in which it is notice filed or qualifies for a corresponding exemption from such requirements. For information about FourStar’s registration status and business operations, please consult the Firm’s Form ADV disclosure documents, the most recent versions of which are available on the SEC’s Investment Adviser Public Disclosure website at www.adviserinfo.sec.gov/
The Optimized Investor
