
An Economic Snapshot
& Weekly Market Review from March 3rd, 2023

The content of this Newsletter is to provide you with Economic insights to assist you in making better decisions with your investments. Unlike many other financial periodicals we will not mention specific companies, unless it is relevant to an overall economic issue. We welcome your questions on economic concerns and will address in our newsletter. just email us at info@optfinancialstrategies.com #FinancialAdvisor,#investmentmanagement #wealthmanagement #financialplanning #retirementplanning #401kplans
Week In Review
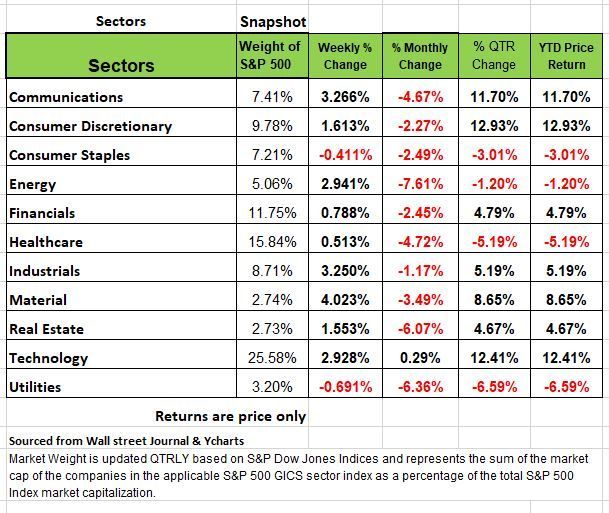
All of the major indices ended the week up last week with the NASDAC having the largest return for the week with a +2.58% increase followed by the Russell 2000 +2% the S&P 500 + 1.9% and the DOW +1.75%. Volatility continues to be the trend as investors continue to ponder what the Fed will do with interest rates and whether the economy will shrug off these economic issues. While January provided some investors with hope and posted handsome returns for the first month of the year, February took back much of those gains in fact the DOW was in negative territory for the year at the end of trading on Feb 28th but rallied the rest of the week to inch out a few points. The materials sector had the largest percentage increase this week, up 4%, followed by increases of 3.3% each in communication services and industrials. Just two sectors fell: Utilities slipped 0.7% and consumer staples edged down 0.4%.
January factory orders are due on Monday, followed by January wholesale trade and consumer credit on Tuesday. February private-sector jobs data from ADP will be released on Wednesday along with Chairman Powell’s testimony to congress, rounding out the week, jobless claims on Thursday and the February nonfarm payrolls and unemployment reports on Friday.
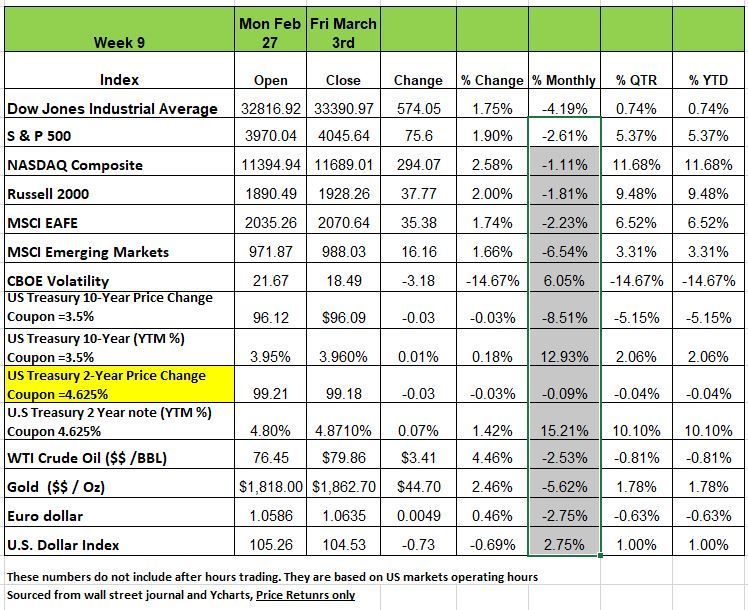
It’s a similar story for the fixed-income markets. The 10-Yr. T-Note ended last year at a 3.88% yield, fell to 3.40% by the end of January. Then it pierced the 4% level (4.07%) on March 1, falling slightly to close the week (March 3) at 3.96%. Such volatility is not a wonder considering the mixed data signals from the economy. Economic data released last week showed the ISM Manufacturing Index missed expectations and remained in contraction territory in February. The same report showed the ISM Prices Index unexpectedly moved from decreasing to increasing, with raw materials prices rising for the first time since September. Unlike manufacturing, the ISM Services Index remained in expansion territory in February and expanded by more than forecast. Prices paid by servicers continued to increase but at a slower rate. Those reports follow data from the prior week showing the Fed’s preferred inflation gauge was higher than expected. Taken together, the data suggests persistent inflation and continued rate hikes. Initial jobless claims were lower than forecast for the week ending on February 25.
The 2-year Treasury almost pierced the 5% yield mark on Thursday reaching a high of 4.966%. Keep in mind the coupon on that 4.625% so prices a dropping over concerns that rates will keep going higher.
Economic Snapshot
Over the past several few weeks, a number economic and investing pundits had decided that the pessimistic narrative had it wrong all along, that the US isn’t headed for a hard landing, which would mean a recession, it isn’t even headed for a soft landing, which would mean a prolonged period of low economic growth.
What they are telling the public is that there will be no landing at all, that the US economy reaccelerates from here and does just fine. No fuss, no muss. That means the S&P 500 hit its bottom back on October 12 at 3577 and that the bear market is most likely over. Of course, we know that most of these professionals are compromised and since their objective is to attract investors that can give their firms more money to invest/manage.
Investors want to be told that they will make money otherwise why give it to someone. But keep in mind that investing blindly in an unstable market can be a quick way to reduce the assets on your balance sheet. Especially if your portfolio is comprised of multiple ETF and other funds. You can make money in any market environment lots of skilled investors do but that means being more tactical and not having a portfolio on auto pilot.
Here is what we see economically. While financial results from Q4 deviate significantly from sector to sector, forward guidance from most companies is a bit more consistent and pointing towards a softer economic environment as demand slows and inflations remains persistent. Remember CEO’s do not want to paint a gloomy picture either since that would trigger a sell off, of their company’s stock. But they cannot be over optimistic because when they miss their projections the stock will eventually suffer.
Over 90% of the S&P 500’s companies reported Q4 financial, JP Morgan is tracking 4Q22 operating earnings per share (EPS) of $49.37, representing y/y and q/q declines of 13.0% and 1.9%, respectively.
S&P 500 operating margins are now sitting at 10.8%, down from 13.4% in 4Q21 and 11.3% in 3Q22. At the sector level, energy and utilities have led the pack this earnings season due to higher oil and gas prices. Keep in mind this sector is also boosting the numbers for the rest of the average earning, so there is even a great decline.
Industrials are set to record another quarter of y/y growth due to resilient spending on services offsetting softening manufacturing demand. Consumer discretionary, communication services and information technology – all of which are levered to non-core spending – had another tough quarter, as higher labor costs and souring consumer confidence weighed on profits.
While the corporate outlook has deteriorated, the economy seems to continue to hum along so far this year. Last Friday’s January personal income and outlays report indicated personal income increased 0.6% m/m and consumer spending increased 1.8% m/m, with the personal saving rate rising to 4.7%.
But keep in mind that much of the boost in personal income and personal saving was driven by the 8.7% Social Security cost-of-living adjustment and higher compensation, which will wane as wage growth moderates.
While consumer spending remains strong, the steep increase in credit card debt highlights the degree to which spending is being supported by borrowed money. This is not a good sign The consumer’s increasing reliance on borrowing should make further increases in consumer spending unsustainable, suggesting that a significant drop may be on the horizon.
On Friday (February 24) at a monetary policy forum sponsored by the University of Chicago’s School of Business, a paper authored by several noted economists including former Fed Governor Frederic Mishkin, said:
- There is no post-1950 precedent for a sizeable… disinflation that does not entail substantial economic sacrifice or recession.
- We find no instance in which a central-[bank] induced disinflation occurred without a recession.
- our analysis casts doubt on the ability of the Fed to engineer a soft landing in which inflation returns to the 2 percent target…without a mild recession.
There is tons of evidence strongly correlated with Recession (such as the Conference Board’s Leading Economic Indicators, the inverted yield curve, or the business surveys). We’ve been wondering why it has taken the financial markets so long to acknowledge this, especially the equity side with an oncoming Recession. While the Payroll and Retail Sales numbers appear strong, in both cases, the raw, underlying data (i.e., Not Seasonally Adjusted) were eye popping (-2.5 million jobs; -$100 billion Retail Sales). The seasonal factors change very slowly and don’t account for the recent behavior changes caused by the pandemic.
The Household Survey has been very consistent that there have been no full-time jobs created since last May. In fact, some people are working 2 part time jobs and that is being miscounted by the BLS. After poor holiday sales, more unwanted inventory went on sale than was the case in previous years. Because the seasonal factors can’t deal with such matters, the Seasonally Adjusted data aren’t reliable indicators of the underlying trends.
Housing has always been a reliable indicator of the health of the economy, and we have addressed this several times in past articles. There has been a precipitous fall in existing home sales, now below the lows of the pandemic economic shut-down in 2020 and approaching the lows of the financial crisis 15 years ago.
And as demand fades away, prices follow. It fell from +25% (June 2021) to now just barely positive from year earlier levels. No doubt this turns negative soon. The Case-Shiller Home Price Index has fallen for six months in a row and is down at a -9% annual rate from its June peak. Economists sometimes refer to a phenomenon called the “wealth effect.” When people feel like they have a significant nest egg, they are likely to spend more freely. But if they see that nest egg shrinking, they become more frugal. In the U.S. and around the world, home prices have risen significantly during the pandemic era. But they have now started to contract. As this continues, the” wealth effect” will become more pronounced, more consumer frugality.
But one major concern are those individuals that overpaid for homes in their rush to exit metropolitan areas. As the unemployment rate increases and prices drop, we may find ourselves with a repeat of the housing recession of 2008. It will not take much for homeowners to be upside down on their mortgage (equity is negative) and unemployed may cause another collapse.
Our society is driven by credit buy now pay later and with rising interest rates more consumers are falling behind on payments. Delinquencies are rising in both credit card and auto loans. There is a similar pattern in subprime auto loan defaults to what occurred during the Great Recession in 2008. This is a reliable indicator of the health of the working middle class.
Now if we look at bank credit, since the Fed began raising interest rates in Q2 2022, demand for auto loans and mortgages tanked. The demand for credit cards and commercial loans stayed buoyant for a while but has now also surrendered. Mortgage applications fell at double digit rates the week of February 17 (-13.3% from the prior week) as mortgage rates did an abrupt about face when the fixed income markets reversed course and tightened financial conditions. Banks are now rapidly tightening credit standards. These are not good signs for an economy dependent on credit.
In Tuesday’s edition of the Wall Street Journal (February 21), a headline: Office Landlord Defaults Are Escalating as Lenders Brace for More Distress. The article cited recent office building defaults, one in L.A., the other in NYC. According to Owen Thomas, the CEO of Boston Properties, “Commercial real estate markets are currently in a recession.” The growing number of distressed office buildings reflects a recognition on the part of both owners and lenders that the robust return to the office isn’t likely to ever materialize. Office vacancy rates are now 12.3%. Pre-pandemic, they were 9.2%. In addition, sublease offers are the highest ever recorded. (see https://www.wsj.com/articles/office-landlord-defaults-are-escalating-as-lenders-brace-for-more-distress-894938c0?mod=Searchresults_pos1&page=1)
Our main concern is that he longer it takes for the Federal Reserve to acknowledge that the economy is weakening the more damage will occur and the longer it will take to come out of the recession. What most people do not realize is that they are all contributors to the environment, while a number may argue that working from home is better and saves them time commuting, commercial landlords are impacted hence the loans that they have on the building are impacted. The default rates on loans are impacted, the restaurants that once served you lunch are impacted as are the public transportation workers that assisted with worker’s commutes. Convenience may be better for you but not the economy. At some point it the near future it will catch up to us.
A Technical Perspective
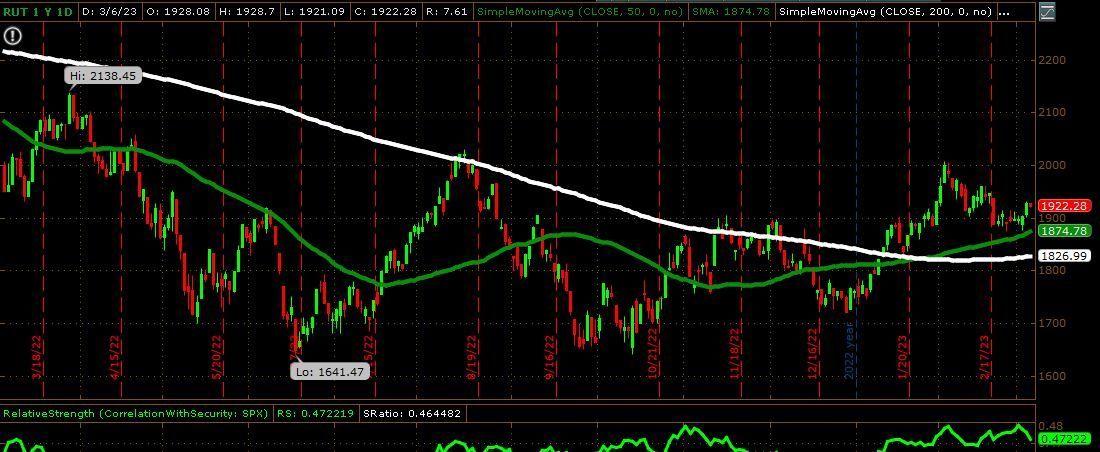
Small cap stocks have been outperforming large caps so far this year, with the Russell 2000 Index (RUT) gaining over 9% versus 5% for the S&P500. After a month of lower highs and lower lows, the trend reversed late last week. This small change happened right at significant technical support near $1,885, which was also a Fibonacci support level measured from the 2022 decline, and just above the 50-day moving average. The MACD never turned negative, and the RSI stayed above 40 through the entire pullback, indicating underlying trend strength. Friday’s rally pushed the index over its down sloping resistance line, which it will need to stay above for more bullish signals to materialize.
Sector Rotation
Looking at the global markets, international equities continue to rank higher than most US sectors on a risk-adjusted basis. The US markets are not favoring more traditionally “defensive” industries. Canterbury’s risk adjusted rankings show that Industrials, Basic Materials, Financials, and Information Technology are the top 4 S&P 500 sectors, while those traditionally “defensive” sectors like Utilities, Staples, and Health Care are at the bottom of the sector ranking.
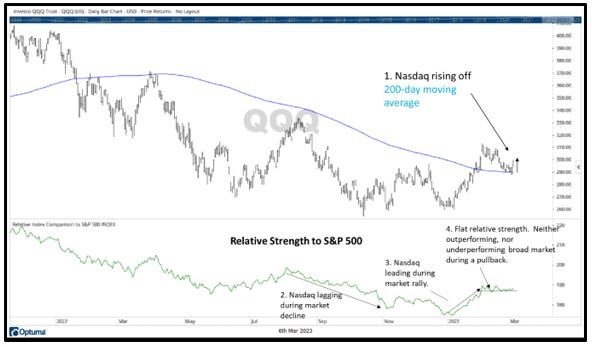
The Nasdaq index is primarily composed of technology-related securities. These same stocks play a large role in the movement of the S&P 500, due to their large market capitalization. Because of their large market share within the index, technology stocks and the Nasdaq have tended to lead during market rallies and lag during declines. With the markets recent, slight pullback from its latest high, one positive is that the Nasdaq index has not lagged. In fact, its relative strength to the S&P 500 since the market’s peak in early February has been flat.
In the chart below, you can see that the Nasdaq is attempting to test its 200-day moving average for support. Last Friday, the Nasdaq rose above its 200-day moving average (point 1). The lower portion of the chart shows the Nasdaq’s relative strength to the S&P 500.
While the Nasdaq has previously underperformed during market declines (point 2) and outperformed during rallies (point 3), the Nasdaq’s relative strength vs the S&P 500 has been flat during the recent pullback (point 4).
Right now, many major indexes, like the S&P 500 are at a point of support. The market index is currently sitting at the intersection of some trend lines and its 200-day moving average. Last Friday, a few of these indexes made a move higher in attempt to confirm support. Although this was a short-term move, it is a step in the right direction to forming another higher low. We will see if that trend can continue.
No one can predict what the market’s next move will be, although many will try. Fundamentally, I think many economists agree that the economy is not in a great place right now. Up until the last few weeks, the markets seemed to believe differently. Markets are a leading indicator of the economy.
Right now, many major indexes, like the S&P 500 are at a point of support. The market index is currently sitting at the intersection of some trend lines and its 200-day moving average. We will see if that support can hold. Source Brandon Bishoff
The Week Ahead
Interest rates have been driving equity markets recently and will remain in focus with the U.S. jobs report, Treasury auctions, and central bank decisions all on tap this week. Additionally, Fed chair Powell begins his two-day appearance before Congress on Tuesday, which will be closely followed for any hints of faster or slower monetary tightening. According to fed funds futures there is a 70% probability of a 25bps hike at the March 22 meeting, with 30% odds of a 50bps hike. February nonfarm payrolls are expected to be above 200K, nowhere near January’s shocking 517K that sent rates on their recent ascent, but still indicative of a hot labor market. The ADP and JOLTS releases on Wednesday 3-7-2023 will add more color to the employment picture. Internationally, there are interest rate verdicts from central banks in Australia, Canada, and Japan to keep currency traders on their toes. This will be BOJ governor Kuroda’s last meeting, and with inflation well above target and the yen flagging, it begs the question whether the groundwork for policy change might be laid. The Bank of Canada signaled a pause at its last meeting, which may have been premature given core inflation readings.
This article is provided by Gene Witt of FourStar Wealth Advisors, LLC (“FourStar” or the “Firm”) for general informational purposes only. This information is not considered to be an offer to buy or sell any securities or investments. Investing involves the risk of loss and investors should be prepared to bear potential losses. Investments should only be made after thorough review with your investment advisor, considering all factors including personal goals, needs and risk tolerance. FourStar is a SEC registered investment adviser that maintains a principal place of business in the State of Illinois. The Firm may only transact business in those states in which it is notice filed or qualifies for a corresponding exemption from such requirements. For information about FourStar’s registration status and business operations, please consult the Firm’s Form ADV disclosure documents, the most recent versions of which are available on the SEC’s Investment Adviser Public Disclosure website at www.adviserinfo.sec.gov/
The Optimized Investor
