
Where are the Markets and the Economy Heading?
& Other Economic News from the
Week Ending August 26th 2022

The content of this Newsletter is to provide you with Economic insights to assist you in making better decisions with your investments. Unlike many other financial periodicals we will not mention specific companies, unless it is relevant to an overall economic issue. We welcome your questions on economic concerns and will address in our newsletter. just email us at info@optfinancialstrategies.com #FinancialAdvisor,#investmentmanagement #wealthmanagement #financialplanning #retirementplanning #401kplans
The Equity Markets got clobbered last week with price declines ranging from -4.44% (NASDAQ) to -2.94% (Russell 2000) The S&P 500 closed the week down for a second straight week. Most of this downward movement came on Friday after Federal Reserve chairman Jerome Powell's press conference at the Jackson Hole Fed symposium. Powell’s blunt comments about the economy and the Fed’s mission to wrangle inflation spooked financial markets and drove all the major US indices to significant declines.
Basically, Powell threw cold water on the possibility that the Fed would moderate restrictive monetary policy to avert a recession.
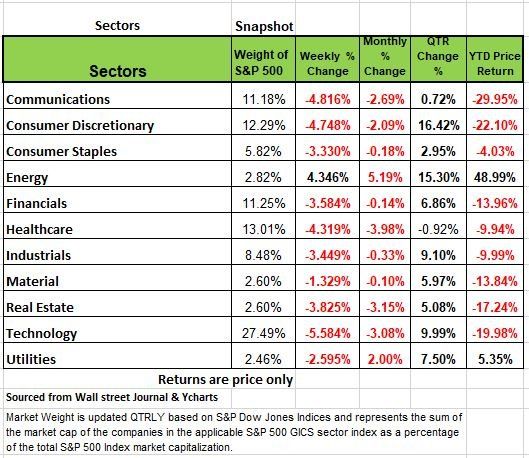
All but one of the 11 sectors ending the week in the red. The one exception was the energy sector which closed higher for a third consecutive week with a 4.3% gain fueled by comments from members of the OPEC concerning production cuts to stabilize prices.
The tech sector limped into the weekend down by more than -5.6%, as disappointing guidance from Salesforce (CRM) and Nvidia (NVDA) underscored the sector's vulnerability to macroeconomic headwinds. Both saw their price targets cut by Wall Street analysts after releasing second-quarter results after Wednesday's close.
Financial stocks were weighed down by the combination of higher Treasury yields and broader market pressure, adding another -3.6% to last week's loss.
The industrial sector closed with a loss of -3.4% as heavy selling pressure on building stocks was offset by gains in defense companies
The consumer discretionary and consumer staples sectors were lower by -4.8% and -3.3%, respectively, while utilities were down -2.6% for the week. Real estate stocks were down a collective -4% with the poor performance of the housing market causing REIT stocks to slide by as much as -6%.
Gloomy data on manufacturing and the housing market this week showed new home sales plunging -12.6% in July while pending home sales were down another -1% as higher mortgage rates continue to choke off demand. The S&P Global services PMI fell to its lowest level since May 2020 while the Richmond Fed manufacturing index sunk to a 27-month low.
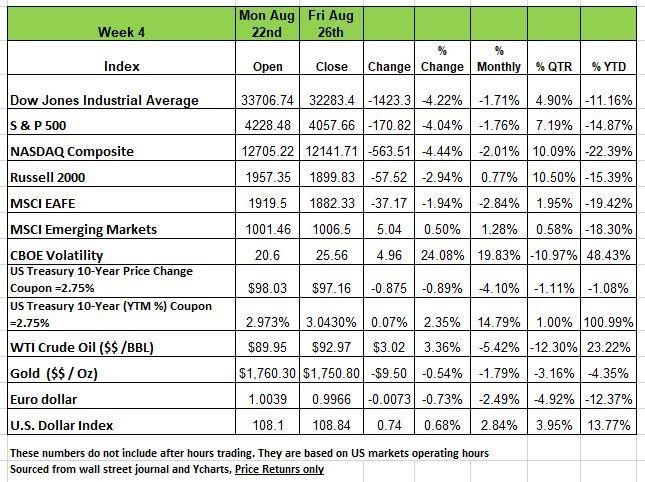
U.S. Treasury yields rose steadily through the week, (remember for yields to rise prices must decline) the 10 yr Treasury closed at 3.043% while the 2 Year Treasury closed at 3.38% hence the yield curve is still inverted. Again, at last week’s Jackson Hole meeting the Fed Chief used the opportunity to reinforce messaging that inflation remains too high and lowering it remains the priority. Quoting Minneapolis Fed President Neel Kashkari’s comments to perhaps provide a less nuanced take on the current state of inflation: “This is a raging inferno. And so, I think a raging inferno entails significant risks.” Mr. Powell’s official comments indicated that “another unusually large” potential hike could be decided upon in the next meeting in September. Mr. Powell stated that “restoring price stability will likely require maintaining a restrictive policy stance for some time” and that “the historical record cautions strongly against prematurely loosening policy.” He went on, saying ominously, “Restoring price stability will take some time and requires using our tools forcefully to bring demand and supply into better balance.” We will be paying dearly for the actions taken by the government during the pandemic lockdown. The extended benefits and consumer behavior is coming at a cost, and this is just the beginning of it.
The State of the economy
As mentioned above the big news of the week was the Fed’s position on fighting inflation. The Fed’s dual mandate is to pursue economic goals with maximum employment and price stability. But one often comes at a cost of the other.
Powell reiterated that inflation remains too high and that the Fed is determined to bring it back down to its 2% target, even if they must risk weakening the economy in the process. Powell specifically noted that “reducing inflation will require a sustained period of below trend growth.” This tough talk comes just as we have begun to see an improvement on the inflation front. The July CPI report showed headline CPI remaining unchanged m/m and a notable deceleration in y/y growth.
Looking ahead to the August report, declining gasoline prices and lower airline fares should provide additional relief, but the rest of 2022 could be mixed with natural gas prices rising and higher wages putting a floor underneath inflation. We expect inflation will decline significantly in the coming months and continue into 2023, as weakening demand and improving supply chains ease price pressures.
The key question is whether the current path to 2% inflation is quick enough; the path to normalcy will be slow and could vary greatly depending on the economic backdrop. Even in a scenario in which headline CPI grows at a consistent 0.2% m/m rate, the y/y growth figure would take a full 12 months to come down to just above 2%.
But what does all this mean for portfolios? If the Fed chooses to prioritize controlling inflation over economic growth, this will favor value stocks more than growth companies. On the other hand, a more moderate pace of tightening could be a boost for U.S. equities and credit. In either situation, however, we do expect economic growth to slow; slower growth implies lower rates. The question is how long before that happens.
What Q2 is Telling Us
If you pay attention to the numbers, they will tell you where the economy is heading. Regardless of all the expert opinions from those trying to lure you into giving them your money, the economy is not all that healthy regardless of the employment data. For instance, the major retailers all disappointed with their Q2 earnings. Besides Walmart, Target, and Kohl’s, Nordstrom, a retailer catering to the more affluent, cut their profit and sales forecast, remarking that “demand and traffic are slowing markedly.” Macy’s reduced its earnings guidance by -30%, while Ross and BJ’s Wholesale announced inventory clearance sales. Semiconductors which we in short supply during the pandemic and the cause for many industries having production issues, is now seeing a leader Nvidia warning on revenue declines (too much inventory); Peloton had another quarterly loss (couldn’t make money even during the Covid era), and Dell Computers cut its outlook citing slow personal computer sales. To show the extent of the inventory issue, on a Y/Y basis, Walmart’s inventories are +25% higher, Target’s +36%, and Kohl’s +48%.
Get ready for major clearance sales.
Backlogs and vendor delivery delays have eased significantly as have production bottlenecks. This implies further supply easing and lower inflation numbers in the months ahead, even without further Fed action. Even the Fed’s own regional bank indexes are seeing significant easing in supply chains.
Housing is Sinking
Retail’s inventory issues are not isolated, we also see excess inventories in new housing with skyrocketing months’ supply as there are fewer prospective buyers and cancellations are the highest since the Covid lockdowns. Of course, in some part of the country rents are increasing since demand has risen as we have penned in previous blogs its payback time for all the landlords that got stiffed during the pandemic
Toll Brothers, America’s largest luxury home builder, says its order books contracted -60%!
New home sales in July fell -12.7% M/M on top of June’s -7.1% result.
On a Y/Y basis, new home sales are down -30% and are falling at nearly a -60% annual rate on a year-to-date basis. At a 511K annual rate in July (consensus 575K), the level is less than the 582K Covid low of April 2020.
Existing Home Sales fell -5.9% M/M in July, are down six months in a row and -20.2% Y/Y. Marketing times are now rising and prices have begun to soften. July’s Pending Home Sales (new contract signed) fell -1.0% in July (down in eight of the last nine months) on top of a -8.9% fall in June.
For housing, the worst appears to still be on the horizon as mortgage applications for purchase fell another -2% the week of August 19, are down -21% Y/Y and, except for the Covid lockdown, now sit at a 22 year low. Refi apps? They are down -83% Y/Y
Other Financial Indicators
We’ve already seen the first bankruptcy in the mortgage lending business – First Guaranty, co-owned by PIMCO, couldn’t generate enough volume to bundle and sell and was forced to file.
The Census Bureau reported that 40% of Americans are now having trouble in meeting their monthly financial obligations.
The S&P Global PMI (Purchasing Managers Index) for the U.S. for August showed up at 45.0 (50 is the demarcation between expansion and contraction), down further from July’s 47.7. The services sub-index was 44.1 (47.3 in July) while the Manufacturing sub-index was still positive at 51.3, but down from July’s 52.0.
The Richmond Fed’s Manufacturing Index for August was -8, down significantly from 0 in July. Shipments, Orders, Backlogs, and Capacity Utilization were all in contraction, and Vendor Lead Times, a measure of supply chain tightness, at -14, was the lowest since March ’09. This particular metric was 0 in July and as high as 45 last March and shows what is happening on the supply side (a positive sign for lower future inflation).
The Kansas City Fed’s Manufacturing Index was 3 in August, down from 13 in July. It was 37 in March, and the fall over the past five months is unprecedented, even faster than during the Great Recession. Like in Richmond, Production, Shipments, and Orders were all in negative territory.
The Chicago Fed’s National Activity Index (over 80 variables) showed up negative for the second month in a row with its Sales/Orders/Inventories, Personal Consumption/Housing, and Production/Income sub-indexes all contracting.
The NY Fed’s Manufacturing Index was -31 in August.
So, it appears that both services and now manufacturing have hit a wall.
In the rest of the world, the Eurozone continues to fall into an energy induced Recession, although it appears that the natural gas situation for the upcoming winter won’t be as dire as initially thought.
The economic indicators continue to move lower with the all-important housing sector leading the way, and both manufacturing and the service sector either showing outright contraction or weakening substantially.
The Fed continues to use is lagging indicators to make decision and the concern that that they will continue looking at the rear-view mirror more than the road ahead. The Feds track record is not all that great and seems to be more reactionary which is never a good place to make important decisions. Source Economist Bob Barone Ph'D
Student Loan Forgiveness
The proposal from the White House to forgive student loans up to $10,000 has become another hot topic. Is it fair? We struggle again with what is fair and whether the White House is using this tactic to drive more votes in the midterm elections. But let’s try to look at this as objectively as possible.
In a world where parents & students go into debt to finance higher education and where alumni, corporations, and Congress are besieged with calls for more donations and grants to colleges and universities, the time is long overdue to ask why college is so costly.
One of the reasons educations is so high is that most Colleges and Universities are Non-Profits, meaning that they do not have to operate like a business, and obviously they do not pay taxes. They often pay outrageous salaries to professors, (many of whom make more money for research funded by Grants), assistants and administrators and worse hire more people than may be necessary.
There is no accountability for operating like a privately owned business might. Money flows into many of the top universities from Alumni. Many articles have been written about the staggering size of endowment funds from Yale, University of Texas, and Harvard to name a few. But perhaps the biggest culprit is the Federal government itself. The government has a specific formula it uses to provide funds to colleges, if tuition remained low then the amount of money the university would receive from the government would decline significantly. Universities would lose much government funding if their cost remained constant.
In addition, many students receive some form of federal aid, so keeping the price high helps with the formula for more Federal aid which goes directly to the college.
Tuition cost have increased at a faster rate than inflation over the past 30 years and it is mostly attributed to the government and the programs that have been develop that are giving incentives to colleges to raise tuition.
But there is another fundamental issue with the way the forgiveness plan is structured, it penalizes someone for being successful. The plan is to offer $10,000 of debt relief to those making less than $125K a year. Depending on where you live $125K does not go as far in NYC or San Francisco as it does in Kansas or other smaller cities throughout the U.S. Once again, the Federal Government is making a general assumption that a specific dollar goes the same distance equally thought the U.S.
Lastly many students enter college and get degrees in a liberal art or fine art that really does not provide value in in corporate America. Earlier this year we wrote about how many Universities sell student on the idea that a master’s degree would help them in their career. The example used was a student that received his master’s in film production, he accumulated over $100K in additional debt, when he graduated. The degree provided him with few opportunities and his job at $38K /year barely left him with enough money to survive let alone pay down his debt. Did the University mislead him? Should he have done more research prior to spending all that money. Where do we draw the line on responsibility?
The Shadow Economy
At some point in time every one of us have contributed or participated to the “Shadow economy” for example a factory worker has a second job driving an unlicensed taxi at night; a plumber fixes a broken water pipe for a client, gets paid in cash but doesn't declare his earnings to the tax collector; a criminal executes a sale of an illegal/stolen product with a prospective buyer in a back alley. These are all examples of the underground or shadow economy—activities, both legal and illegal, that add up to trillions of dollars a year that take place "off the books," out of the gaze of taxmen and government statisticians.
Although crime and shadow economic activities have been a fact of life, ever since society has imposed a tax on its citizens. But now these shadow economies are increasing around the world—almost all societies try to control their growth, because of the serious economic consequences:
A prospering shadow economy makes official statistics (on unemployment, official labor force, income, consumption) unreliable. Policies and programs that are framed based on unreliable statistics may be inappropriate and self-defeating. Not to mention the burden of repaying all the money spent to subsidize those operating in an underground environment.
The growth of the shadow economy can set off a destructive cycle. Transactions in the shadow economy escape taxation, thus keeping tax revenues lower than they otherwise would be. If the tax base or tax compliance is eroded, governments may respond by raising tax rates—encouraging a further flight into the shadow economy that further worsens the budget constraints on the public sector. (On the other hand, at least two-thirds of the income earned in the shadow economy is immediately spent on the official economy, resulting in a considerable positive stimulus effect on the official economy.)
A growing shadow economy may provide strong incentives to attract domestic and foreign workers away from the official economy.
Estimates vary widely, but some put the underground economy at 10% to 15% of U.S. gross domestic product (GDP). In 2021, U.S. GDP was estimated at $24 trillion, so that puts the underground economy at more than $3.6 trillion.
That number must be taken as a guesstimate. There's an obvious complication in trying to determine the size of any country’s underground economy. The activities in it are not reported, and those engaging in it do their best to remain undetected.
There have been many studies done on the effects of a shadow economies. But none conclusively explain how an increase in the shadow economy or informal sector affects overall economic growth. According to some, the shadow economy depresses the growth of GDP. They contend that shrinking the shadow economy will increase tax revenues, stimulating a rise in public spending, especially on infrastructure and services that support production expansion, leading to a rise in the overall economic growth rate. The contrary view is that the informal sector is more competitive and efficient than the formal sector, and thus that an increase in the shadow economy will stimulate overall economic growth.
This brings us to the Inflation Reduction Act. Jared Bernstein of President Biden’s Council of Economic Advisers told a reporter on Aug. 16 that the $45.6 billion allocated in the Inflation Reduction Act to expand Internal Revenue Service compliance efforts “will not be spent on increasing audits of anybody” making less than $400,000 a year.
“IRS enforcement is going to target those well above $400,000,” Mr. Bernstein pledged. “There’s no targeting of the middle class!” We doubt that since the IRS will be hiring some 80K new agents and according to estimates there are approximately 154 million tax returns of which 2.8 million earned over $400 MM, so the 80K new agents will have approximately 35 audits per year, so we do not think that the target is at the $400MM and over part of our population it will expand to a larger portion of the population because the Federal government needs money to payback all of the money it spent during the pandemic. Source https://www.imf.org/external/pubs/ft/issues/issues30/#:~:text=the%20official%20economy.-,What%20Is%20the%20Shadow%20Economy%3F,from%20monetary%20or%20barter%20transactions.
A Technical Perspective
For those new readers to our newsletter technical analysis is an investment strategy /trading discipline that relies on identifying opportunities by analyzing statistical trends gathered from trading activity, such as price movement and volume. While no one can identify the bottom and peak price of a security, technical analysis tries to identify opportunities close to it.
The S&P 500 declined -3.37% on Friday, -4.04 on the week. After a +17% rally from the index’s low point in June, through mid-August, volatility reared its ugly head and brought the total number of outlier days (a trading day beyond +/-1.5%) in 2022 to 52, out of 164 trading days so far. As we have discussed in previous blogs During a normal, low volatility market environment, one would only expect 7 or 8 outlier days to this point in the year. As we all know by now, this is not a low volatility market environment.
Heading into Friday, the S&P 500 had been in what we refer to as Market State 9. Market State 9 is one of four defined bear Market States. One key characteristic of Market State 9 is that short-term supply & demand indicators are positive, and volatility is high, but declining. Friday’s splash to the market was enough to turn both short-term and volatility indicators negative once again. In other words, the S&P 500 is now in Market State 12, with all indicators being negative. All this came as a reaction to Powell’s rate interest forecast
The rally experienced over the last two months is a common occurrence in a bear market. Bear markets are emotional, with both large declines and large advances. A sharp decline flushes many investors out of the market. Eventually, there are few investors left to sell. Markets then rally, causing many sideline investors to get a bad case of FOMO, or “fear of missing out.” The advance causes cautious optimism as more participants try to hop in on the upward ride. Eventually, the rally runs out of steam, Lucy pulls the football, and Charlie Brown lands on his back.
Markets were not all negative on Friday. Volume on the S&P 500 stocks was lower than the average volume experienced this year. Volume is the term used for the number of shares traded over a given period, usually a single day. It measures conviction. The lower the volume, the less the confidence in the move. So this means that the spread in the price is more significant, prices dropped quicker more dramatically.
So far in 2022, there have been 164 trading days. Friday’s -3.37% down move on the S&P 500 would be the 5th largest trading day (up or down) this year. However, in terms of volume, Friday’s move ranked 129th (using data provided by Optuma Technical Analysis). While it might have been a large day in terms of percentage moves, it was not a large day of shares being traded. We see this as a lack of conviction to the downward swing.
Bear markets often experience higher than average volume. This makes sense given that there is an increased level of emotion. As a matter of fact, 73% of trading days in 2022 (120 total days) have seen larger volume than the average trading day in 2021. The last 12 consecutive days have had less volume than the average trading day in 2021. Friday’s volume would have been about average in 2021, which was a normal market environment.
Markets do all sorts of crazy things during bearish environments. Very few expected to see a large outlier on Friday, just as very few investors, if any, would expect to see a 17% rally over just two months off the market’s lows. Bear markets are irrational.
A single, lower volume, large down day, like we saw Friday, is just one small bit of information in the enigma that is the market. We can take this small bit of information and use it to tell a story but know that no investor can manage the market—the market is what it is.
We can make observations and adjust our portfolios in a way to maintain consistent and low volatility, regardless to whichever market we are facing, bull or bear.
Right now, we know that many “conservative” investors do not feel like their portfolios are very conservative. Bonds took a beating in the beginning of the year These investors characteristically have a mix of both stocks and bonds to balance their portfolio’s diversification But while interest rates were artificially suppressed for so long we know many conservative investors may have been over weighted in Stocks. We know that stocks are in a volatile, bear Market State. We also know that both interest rates and inflation have been on the rise. Rising rates have caused bonds to decline. The 7-10 Year Treasury Bond ETF (IEF) is down about -10.5% year-to-date and -17% from its peak in 2020. The long-term treasury bond ETF (TLT) is down -21% year-to-date and -34% from its peak. So much for bonds being a safety blanket from a volatile stock market.
Source Brandon Bischoff
The Week Ahead
The Atlanta Fed’s GDP model is forecasting 1.6% growth in Q3, while the odds of a 75bps rate hike at the September 21 FOMC are near 60% according to Fed Funds futures. August’s employment report will be released Friday and could have a big impact on both projections. The last three NFP reports have exceeded expectations, so investors will be watching to see how labor markets are holding up. Also, the ADP jobs report returns after a month’s hiatus with an overhauled methodology that may provide additional context. Other events of note in the U.S. include consumer confidence, ISM Manufacturing PMI, Chicago PMI, and factory orders. Overseas, flash CPI figures for Germany and the EU will be the last inflation updates before the ECB meets on September 8. The euro has slid below parity with the U.S. dollar for the first time in 20 years, and policymakers are caught between controlling skyrocketing prices and raising borrowing costs for highly indebted nations.
This article is provided by Gene Witt of FourStar Wealth Advisors, LLC (“FourStar” or the “Firm”) for general informational purposes only. This information is not considered to be an offer to buy or sell any securities or investments. Investing involves the risk of loss and investors should be prepared to bear potential losses. Investments should only be made after thorough review with your investment advisor, considering all factors including personal goals, needs and risk tolerance. FourStar is a SEC registered investment adviser that maintains a principal place of business in the State of Illinois. The Firm may only transact business in those states in which it is notice filed or qualifies for a corresponding exemption from such requirements. For information about FourStar’s registration status and business operations, please consult the Firm’s Form ADV disclosure documents, the most recent versions of which are available on the SEC’s Investment Adviser Public Disclosure website at www.adviserinfo.sec.gov/
The Optimized Investor
