
What Could Cause Markets to Reverse Course?
Weekly Market Review
for March 18th 2024

The content of this Newsletter is to provide you with Economic insights to assist you in making better decisions with your investments. Unlike many other financial periodicals we will not mention specific companies, unless it is relevant to an overall economic issue. We welcome your questions on economic concerns and will address in our newsletter. just email us at info@optfinancialstrategies.com #FinancialAdvisor,#investmentmanagement #wealthmanagement #financialplanning #retirementplanning #401kplans
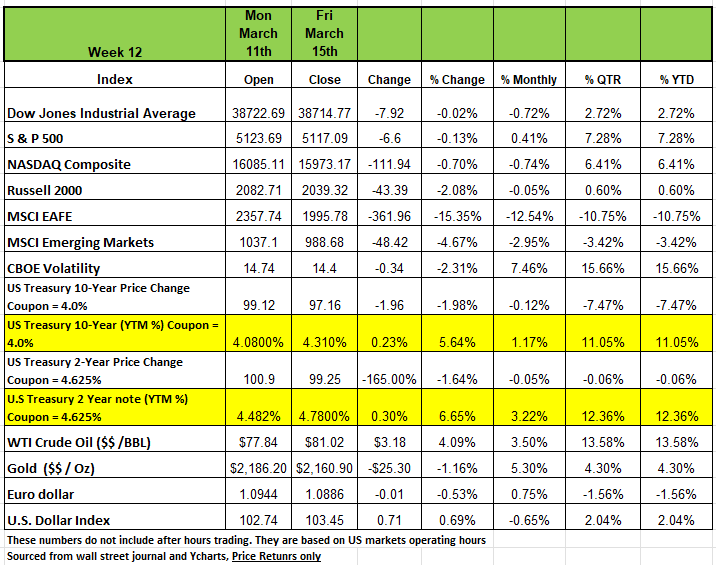
Most of the major indices were down less than -1% last week except for the Russell 2000 which declined -2.08% on the week. The S&P 500 index was basically flat edging down -0.1% on the week, the DOW -0.2 and the NASDAQ -.07% as investors digested higher-than-expected inflation readings for February.
All of the indices are up for the year with the Russell having the smallest return YTD +.60%
The volatile week came as US consumer prices for February were up 3.2% year-over-year, slightly above a 3.1% increase in January and the consensus estimate for a 3.1% increase. The US producer price index was up 1.6% on an annual basis last month after a 1% increase in January. Analysts were projecting growth of 1.2%. Many Market watchers believe the inflation data may lead the Federal Reserve to keep its policy rate on hold until members see further signs that price growth is trending lower. However, it is possible that inflation will continue ticking upward and give the Fed reason to shift course. But it is an election year and an upward move may cause more issues
Treasury yields rose significantly over course of the week on concerns of higher inflation. The Fed Bank of New York survey released on Monday showed that US consumer expectations for inflation over the next 3 years climbed in February, causing Treasury yields to rise moderately. On Tuesday, inflation data was released and showed that the Consumer Price Index rose 0.4% MoM, in line with expectations, and 3.2% YoY, which was slightly above expectations of 3.1%. This added to investor speculation that inflation was not as tempered as previously thought and the Federal Reserve Bank may have to keep rates higher for longer, which led to yields rising moderately again on both Tuesday and Wednesday. Yields continued to rise at an even quicker pace on Thursday as the Producer Price Index increased 0.6% MoM and 1.6% YoY, materially above expectations of 0.3% and 1.2%, respectively. The Fed is expected to keep The Fed Funds Rate unchanged during the March 20th meeting, and the market implied probability of a rate increase sometime during the following 2 meetings dropped from 92.1% to 61.2% over the course of the week. The market implied rate at the end of 2024 rose from 4.376 to 4.608 as well.
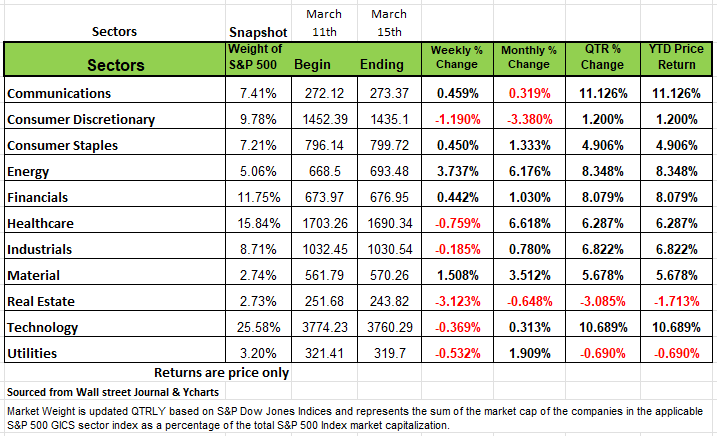
Sectors
The real estate sector had the largest percentage drop of the week, down -3.1%, followed by a -1.2% decline in consumer discretionary. Other sectors that fell included health care, utilities, technology and industrials.
Decliners in the real estate sector included shares of Equinix (EQIX), which fell 6.6%. The digital infrastructure company named Google Cloud Go-to-Market President Adaire Fox-Martin as its new president and chief executive. Its current president and chief executive, Charles Meyers, will transition to the role of executive chairman effective in late Q2.
In consumer discretionary, shares of Tesla (TSLA) shed 6.7% after a UBS report said the electric vehicle manufacturer's deliveries are tracking lower than initially forecast amid weak electric-vehicle demand and slower production in North America and Europe.
On the upside, however, the energy sector jumped +3.7%, followed by a +1.5% rise in materials. Other gainers included communication services +0.49%, consumer staples +0.45% and financials +0.44%.
The energy sector's climb came as crude oil futures also rose.
Gainers included shares of Valero Energy (VLO), which received an investment rating upgrade to buy from neutral from BofA Securities. BofA also raised its price target on Valero's stock to $210 per share from $156. Valero's shares rose +9.5%.
What could cause Markets to change Course?
If you go by the stock market those that have been invested in the U.S. markets are really enjoying themselves with the increase of prices. As of March 1 of this this year, the markets had a Shiller P/E of 34 which is in the top 1% of market history. Keep in mind that the Shiller PE is Price earnings ratio is based on average inflation-adjusted earnings from the previous 10 years, known as the Cyclically Adjusted PE Ratio (CAPE Ratio / PE 10) this as opposed to the last 12 months (TTM Trailing Twelve Months) which is currently around 24.84. Total profits are at near-record levels as well. Keep in mind that, when margins and multiples are both at record levels at the same time, it is basically double counting and could result in double jeopardy It’s possible that we may experience another July 1982 or March 2009 with simultaneous record low multiples and badly depressed margins. But for now and those who are in the market owning U.S. stocks that are very overpriced, there is a reasonable choice of relatively attractive investments, relative to the broad U.S. market of course you need to make the time to find them. So, what on earth could cause such a reversal?
Well as Bob Farrell has said when markets go to extremes they tend to find their way back to their mean. Now the question is over what period?
One thing that may upset the markets would be the outcome of the FOMC meeting and Powells Press conference on Wednesday. The outcome could set the tone in the markets for the rest of the year as investors focus on the Fed’s second meeting of the year. Many are widely expecting that rates will stay the same, no change in policy, which is highly likely at least for this month. However, Fed communications will provide guidance on two important subjects: First, they will update their summary of economic projections and their “dot-plot” forecast for the federal funds rate. (Not that this tool has ever proved accurate), 2nd and in particular Chairman Powell’s press conference, will likely provide some further hints on when and how they could begin to phase out quantitative tightening. The tone of Powells press conferences in the past have pointed towards monetary easing and investors are looking for the same guidance in the months ahead, the implied timing and extent of that easing will most likely have a major impact on markets. So, while many have enjoyed significant returns since the end of last Oct, there is a chance that much of it will be given back if Powell and the Fed governors change their forecast.
Since the last FOMC meeting in January economic data has been mixed, showing a continued, ever so gradual, cooling in economic growth and the labor market, but inflation numbers are somewhat hotter than expected. The Atlanta Fed’s GDPNOW forecast for first quarter GDP growth has slipped from 3.0% to 2.3% since January, while JP Morgans forecasting pegs first-quarter growth at closer to 1.5%. that is a big difference. February’s retail sales report, released last Thursday, was particularly important in reducing these estimates, as it revised retail activity downward in both December and January.
Labor market data also suggest some cooling, even in this tight environment. Both the January and February jobs reports showed stronger-than-expected payroll gains. However, the February report contained hefty downward revisions to gains for the prior two months. In addition, the unemployment rate has edged up from 3.7% to 3.9% between December and February, amid signs that recently higher immigration, although chaotic, is beginning to boost low-end labor supply. So, current wage growth of 4.3% year-over-year is the same as it was five months ago and is still a little higher than the Fed would likely regard as being compatible with 2% consumption deflator inflation.
Finally, based on last week’s CPI data, several economists expect the year-over-year core consumption deflator inflation rate to come in at 2.8% in February, the same reading as in January, well down from its peak of 5.6% in February 2022. However, this number could switch significantly if consumers continue to spend and keep inflation higher.
As the FOMC reviews the economy this week, they should express some satisfaction with the overall picture. Despite aggressive monetary tightening over the past two years, the economy has avoided recession so far, unemployment is low and steady and inflation pressures still seem to be acceptable. However, little progress has been made on that path either since the Fed’s last meeting at the end of January or the prior one in mid-December, when they last provided explicit guidance on the path for interest rates, in the form of their “dot-plot” projections.
And here is where the danger lies.
Among the 19 FOMC contributors to the December dot plot, the median forecast for the federal funds rate was 4.6% for the end of 2024 and 3.6% for the end of 2025 compared to 5.33% today, or, in other words, three 25 basis point rate cuts this year and four next year.
This is a logical approach for an economy that has steady growth with inflation falling slowly to the Fed’s 2% objective. Currently, monetary policy is restrictive, and it makes sense to bring it back to a more neutral stance.
This timetable would allow the Fed to cut only during those meetings when they produced a new summary of economic projections adding extra clarity to their actions and establishing a pattern that markets could get comfortable with. This pattern would allow the Fed to embark on its journey of policy normalization at its June meeting, well in advance of the November elections so they couldn’t be accused of favoring one party or the other by a late-in-the-day policy switch.
If we look more closely at the December dot plot, it’s clear that it wouldn’t take much to upset this plan. At that time, 6 FOMC participants favored exactly three rate cuts in 2024, eight favored fewer and five wanted more. If just two of the six centrists turn slightly more hawkish, the forecast for three rate cuts in 2024 would shrink to two, upsetting this timetable and markets at the same time. In addition those businesses that need to refinance such as the class B and C commercial real estate properties will find themselves in a more difficult predicament.
Investors will be watching the dot plot when it is released on Wednesday to see if the Fed is still on track to deliver a first cut in June. We highly doubt it will happen and they will also listen carefully to Chairman Powell’s words on the phase out of quantitative tightening, otherwise known as QT.
Since June 2022, the Fed has been gradually cutting the size of its balance sheet and in September 2022 the pace of this reduction was increased to up to $60 billion in Treasuries and $35 billion in mortgage-backed securities per month. This program has continued at this pace since then, despite the opening of a bank term funding program in response to the mini banking crisis we saw with SVB and a few other smaller regional banks. As a result, total Fed assets have fallen from a peak of almost $8.9 trillion in April 2022, to just over $7.5 trillion today.
Between 1982 and 2008 with the Great Financial Crisis, the Fed implemented monetary policy in a straightforward way. The Federal Open Market Committee would set a target for the federal funds rate, that is the overnight rate paid by banks to each other to borrow reserves and instruct the trading desk of the New York Fed to buy or sell Treasury bills or other short-term securities to add or drain liquidity from the system and thus achieve that target. At that time, the Fed paid no interest on reserves so commercial banks liked to keep their reserve balances as close as possible to the minimum legally required to back their deposits. This was referred to as a “scarce reserves” regime.
Since October 2008, as the Great Financial Crisis began to unfold, the Fed started paying interest on reserves to exercise greater control over short-term interest rates. Since then, they also began to offer overnight lending facilities to other institutions that don’t qualify for interest on reserves such as money market funds and government sponsored enterprises. Currently, the Federal Reserve pays commercial banks 5.4% on reserves and offers 5.3% to non-bank institutions for overnight reverse repurchase agreements, known as reverse repos. Not coincidentally, the current federal funds rate, at 5.33%, is in the corridor between the offering rate on reverse repos and the interest rate on reserves.
So basically, the Fed’s current operating procedure incentivizes banks to hold onto reserves, since they receive healthy rates on risk free money. There is no need to worry about a loan default. At its essence, the interest rates that the Fed pays banks and non-banks respectively provides a floor for the federal funds rate and the sheer abundance of liquidity in the system prevents the federal funds rate rising much more from that level.
The fact that banks can earn a safe 5.4% on reserves held with the Fed means that they won’t lend reserves to other banks for less than that – thus the Fed’s interest rate on reserves, currently at 5.4%, serves as a floor for the federal funds rate. However, the huge volume of reserves held by the banking system over and above what is necessary to meet various capital and liquidity programs, means that the federal funds rate is unlikely to rise much above this level either.
The rate on these loans, currently at 5.3%, now serves as an effective floor on overnight rates in the market. If the overnight rate rises above 5.3%, non-bank institutions have an incentive to lend reserves. However, if the overnight rate rises above 5.4%, both the non-bank institutions and the banks themselves have an incentive to lend funds overnight, thus truly flooding the system.
So here is where some of the problems lie. The markets are on edge expecting rates to drop this year, consumers have money and are spending, and supplies are not in abundance so with warmer weather coming its possible that inflation could rear its ugly head again, we have not slayed that dragon just yet.
In addition, we need to consider what will happen when the Fed decides to reduce the abundance of reserves in the system? The Fed did this in its last bout of quantitative tightening that began in October 2017 and ended rather abruptly in September 2019, even though total Fed assets at the time were still well above $3.5 trillion.
Given the overlapping liquidity and capital requirements imposed on the banking system in the wake of the great financial crisis, the strong desire of banks to hold cash above these levels and the impact of the public’s willingness to hold currency and the Treasury Department’s account balances at the Fed on reserve balances, it is just not clear how much the Fed can reduce reserves without triggering a spike in short-term interest rates. That limit was, however, apparently reached in the middle of September 2019, when the effective federal funds rate shot above the Fed’s target range which was, at the time, between 2.00% and 2.25%.
In an immediate response, the Fed injected liquidity into the system (by buying) to calm rates down and cut the interest rates on reserves and reverse repos, relative to the federal funds rate target range, to provide a buffer against this happening again. They also effectively ended their program of quantitative tightening. However, the Fed really doesn’t know how far it can push quantitative tightening before reserves are no longer sufficient to hold short-term rates in check.
As of today, nominal GDP is approximately $28 trillion so 11% would be roughly $3.1 trillion. Total reserves plus reverse repo agreements are $4.2 trillion. If the Fed continued its QT program as is for another year it could reduce reserves plus reverse repos by over $1.1 trillion while nominal GDP could be expected to rise by roughly 5%, taking reserves below 11% of GDP, even if reverse repo balances dropped close to zero. But again, everything rests on the consumer and how prices move Its highly unlikely that the Fed will begin to taper QT this year if inflation is not tamed, however if the past two months were anomalies, then we could see the Fed begin to taper QT , but if the upward move becomes a trend the Fed will have to hit the brakes harder impacting both equities and fixed income markets.
Source David Kelly JP Morgan
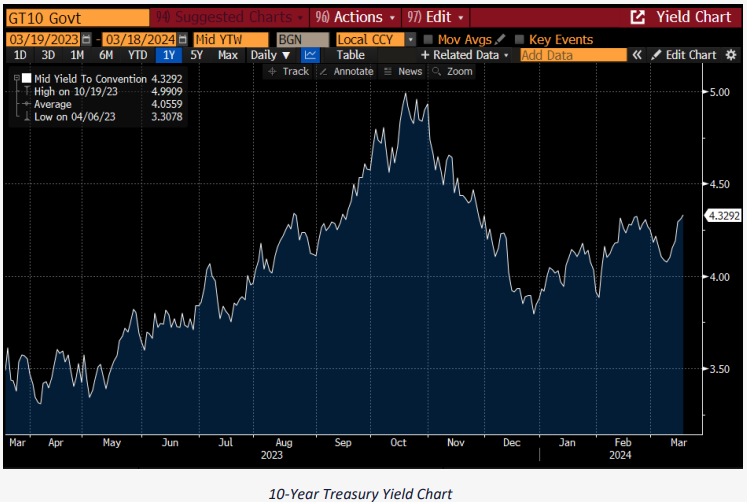
Technical Perspective
10-Year Treasury Yield Source: Bloomberg
The yield on 10’s has pushed up to the highs of the recent trading range, as some Fed rate cuts have been priced out.
4.35% is a key level of support. It would surprise us to see a meaningful move up toward 5% again. While we are not there yet in terms of cuts, it would likely take talk of hikes as an impetus for such a move.
The Week Ahead
Rate decisions from central banks in the U.S., UK, Japan, and Australia will be this week’s focus. U.S. investors will pay particular attention to the Fed’s Summary of Economic Projections on Wednesday, to see if the committee shifts expectations for the number of 2024 rate cuts and the longer-run neutral rate. With the high-flying Nasdaq Composite index essentially flat this month, technology stocks and the broader market could be vulnerable if the Fed chooses a more hawkish policy path than is currently anticipated.
The U.S. economic calendar features monthly housing data, including building permits, starts, and existing home sales for February. Global flash PMIs for March will be released late Wednesday into Thursday, providing insight into inflation pressures and business conditions domestically and abroad. The Bank of Japan’s policy meeting begins later tonight, and although markets are now pricing in the possibility of a move at this meeting, experts expect the BOJ to move slowly in raising rates above zero. The Reserve Bank of Australia also meets later tonight.
In the UK, Wednesday’s inflation data could influence the language in the Bank of England’s monetary
policy statement on Thursday. Finally, economic sentiment surveys from Germany on Tuesday and Friday round out the international docket.
This article is provided by Gene Witt of FourStar Wealth Advisors, LLC (“FourStar” or the “Firm”) for general informational purposes only. This information is not considered to be an offer to buy or sell any securities or investments. Investing involves the risk of loss and investors should be prepared to bear potential losses. Investments should only be made after thorough review with your investment advisor, considering all factors including personal goals, needs and risk tolerance. FourStar is a SEC registered investment adviser that maintains a principal place of business in the State of Illinois. The Firm may only transact business in those states in which it is notice filed or qualifies for a corresponding exemption from such requirements. For information about FourStar’s registration status and business operations, please consult the Firm’s Form ADV disclosure documents, the most recent versions of which are available on the SEC’s Investment Adviser Public Disclosure website at www.adviserinfo.sec.gov/
The Optimized Investor
