
Are we in a New Economic Paradigm?
Weekly Market Review
for March 11th 2024

The content of this Newsletter is to provide you with Economic insights to assist you in making better decisions with your investments. Unlike many other financial periodicals we will not mention specific companies, unless it is relevant to an overall economic issue. We welcome your questions on economic concerns and will address in our newsletter. just email us at info@optfinancialstrategies.com #FinancialAdvisor,#investmentmanagement #wealthmanagement #financialplanning #retirementplanning #401kplans
Week In Review
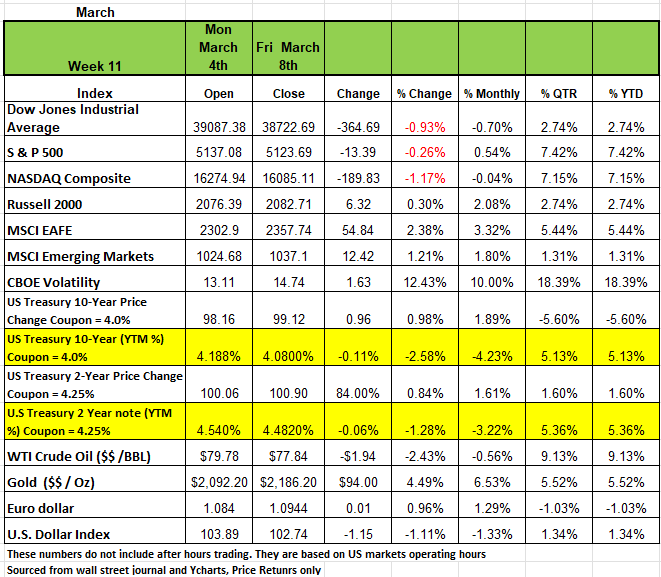
All indices were negative for the week ending March 8th with the exception of the Russell 2000 which posted a 0.30% return on the week The S&P 500 reached a record high before a pullback and ending the week down -0.26%. The NASDAQ posted a -1.17% decline followed by the DOW -0.93%. Much of the pullback came on a mixed jobs report which fueled investor caution, leading the Nasdaq 100 to drop -1.5% on Friday alone.
The dominance of the "Magnificent 7" stocks, responsible for over 20% of the market's 35% gain since Dec 2022, is facing a little scrutiny. Investor concerns were evident in Friday's selloff as tech bellwethers Apple and Broadcom, saw their stocks decline. Broadcom reported disappointing semiconductor revenue, while Apple faced lower-than expected iPhone sales in China and news of its shuttered car division. The hope for an Apple autonomous car cost the company over $10 billion dollars over the life of the project. That is a whopping amount of money to spend on a worthless project.
One sign that investors are shifting risk profile can be seen in the rise of the Utilities sector which was the top performing sector in the S&P 500 with over a 3% return last week. Consumer Discretionary and Tech were the lagging sectors in the index as Tesla dropped over 13%.
Pockets of value still exist in the fragmented market. Big box retailer Target rose over 9% after the company outlined a turnaround plan that includes store upgrades, a new paid membership program, and an expansion of its private label brands. These moves echo the moves of Walmart and Amazon’s longstanding Prime membership program.
Treasury yields dropped a bit last week following several economic reports and highly awaited jobs report data. Yields fell on Tuesday after service sector data for February showed cooling inflationary pressures. The ISM Non-Manufacturing index declined to 52.6 for the month of February, falling short of consensus expectations of 53. Other major measures of activity were mixed, with new orders and business activity increasing but employment activity decreasing. On Wednesday, Trade deficit in goods and services for January came in at $67.4 billion, larger than the consensus expected $63.5 billion. Compared to a year ago, the monthly trade deficit is $2.9 billion smaller but after adjusting for inflation the “real” trade deficit is $0.9 billion larger than a year ago.
Initial jobless claims for the week came in line with expectations at 217k, remaining relatively steady and low by historical standards. Yields remained low Friday morning but bounced back from their session lows after jobs report data was released. Nonfarm payrolls increased 275k in February, beating the consensus expected 200k. However, after downward revisions to December and January reduced payrolls by 167k, bringing the net gain to a moderate number of 19k
By Sector
The weekly S&P drop was due to declines in just three sectors: Consumer discretionary fell 2.6%, technology dropped 1.1% and communication services shed 0.6%. The gains in other sectors were paced by a 3.2% increase in utilities.
Tesla (TSLA) shares led the drop in consumer discretionary. The electric vehicle company's shares tumbled 13% amid a reported 19% year-over-year drop in February vehicle sales in China. Analysts at Morgan Stanley cut their price target on the stock and warned clients that Tesla's exposure to decelerating demand for electric vehicles may eat into 2024 earnings and sharply reduce free cash flow.
In the technology sector, Apple (AAPL) shares fell 5% this week as Counterpoint research showed iPhone sales declined by double-digits in the key Chinese market through the first six weeks of 2024 as the company underperformed key competitors.
Gainers in utilities included shares of Dominion Energy (D), which rose 7.2% this week as the provider of electricity and natural gas provider closed on the sale of its East Ohio Gas utility to Enbridge (ENB) for $6.6 billion, including debt.
On Tuesday, this week the BOL will offer an eagerly-awaited update of the consumer price index, for the month of February. The markets are looking for further evidence of moderate inflation would help to satisfy the Fed’s other major mandate of keeping price growth under control. But consumer income and spending is up, so the outcome is anyone’s guess. By the time this newsletter is posted the number will have been released.
Additionally, this week, investors will receive important inflation data on the producer price index, scheduled for Thursday. New information on import prices, retail sales, initial jobless claims, New York’s manufacturing index, industrial production, capacity utilization, and consumer sentiment will also roll in. Market movement will likely continue to be sensitive to the releases.

A New Economic Paradigm
Are we in a new Economic paradigm? For the better part of the last century and a half American had some very clear economic cycles basically we were either in expansion or contraction and each of these conditions had a center point which was a peak for the expansion and a trough for the contraction. These cycles influenced monetary policy when an economy got too hot expanding too much, inflation reared it ugly head and interest rates increased as did unemployment, defaults on loans and bank failures. When the economy slowed down enough the Fed lowered interest rates to encourage investment and spark hiring. But this model was mostly based on a country whose economy was centered on manufacturing, at least that has been the case since the industrial revolution. Most pundits would argue that the U.S. economy is currently in the late stages of the expansion phase. But it is possible that we may just continue our expansion until some financial, environmental or geopolitical event occurs that shocks the system.
Why? Because the U.S has shift from more of a manufacturing model to a service model economy. Since the late 1980’s more of our manufacturing has been out sourced to countries like China, Unions had less powerful, technology has evolved making businesses more efficient and banks which were once limited to state charters are now global players making them less vulnerable. This in addition to changes in consumer behavior have created a new economic model.
The Traditional Business Cycle
If we look back to the 1950s, coming off of World War II the traditional business cycle at that time looked something like this, the economy was growing at a steady pace due to natural increases in population (baby boom) and productivity. The economy began to quicken the pace. Based on a foundation of steadily growing income, families buy new homes and cars, banks extend new loans, industrialists build new factories, stocks surge and shop windows are festooned with help-wanted signs, as shopkeepers mark up prices as demand out paces supply.
Then central bankers become alarmed about inflation and try to cool things down by raising interest rates. At first, everyone ignores the threat and the party continues. Then loan defaults rise, some banks fail, credit tightens and spending slows. Consumers get more worried and decide to postpone buying things (homes, cars, furniture etc.) Then inventory piles up and factories shut down production, layoffs begin as shopfronts are shuttered and unemployment soars.
Then as recession and fear become concerns central bankers cut rates and some wealthier consumers begin to buy again, this increase demand for products and manufacturing facilities that had either slowed or shut down production lines need restart the factories to meet demand. The stores slowly reopen, new enterprises emerge, unemployment begins to decline and the economy beings to recover.
That makes sense right, not too hard to predict. This traditional business cycle model served as a pretty good description of the bumpy path followed by the U.S. economy up until the 1980s.
The New Stretched Out Expansion
According to the National Bureau of Economic Research, between the late 1850s and the early 1980s, the U.S. economy experienced no fewer than 30 separate recessions, lasting an average of 18 months, with expansions between the recessions averaging just 33 months.
However, since the 1980s, the economy’s vulnerability to the traditional business cycle has changed. The U.S. economy had generally become less prone to inflation due to more efficiencies in transactions and increased inequality that diverted demand from goods and services to financial assets.
The economy had also become less vulnerable to recession. Consolidation of the banking industry sharply reduced bank failures. Better information on inventories controls tamed the inventory cycle. Rising international trade acted as an offset to slowing domestic demand, and the growth of the service sector, relative to the more cyclical manufacturing and construction sectors, made the economy more stable and, importantly, less sensitive to interest rates.
Given these significant structural changes in the economy, rising consumer demand is now less prone to cause runaway inflation and Fed tightening is less likely to trigger deep recession.
As a result, since the early 1980s, we have seen just four recessions, lasting an average of 9 months, divided by long stretches of expansion that have lasted an average of 104 months each, not counting the current expansion that is now in its 47th month since the pandemic shut down in March 2020.
It appears that academics need to account for this new model in predicting any economic forecast moving forward. Our economy is still moving forward in the shadow of the pandemic recession, the inflation sparked by the pandemic, the commercial real estate vacancies, the trillions spent by the government and the monetary policy response, the issues in Ukraine and the Middle East as well as the tensions building with China and immigration. Even with all of these disruptions, an aggressive Fed tightening has not been enough to sink economic growth.
In this new model, the economy could still be derailed by a shock but is much less vulnerable to demand-driven overheating or a recession induced by policy tightening.
Investment Implications
"The failure of the general market to decline during the past year despite its obvious vulnerability, as well as the emergence of new investment characteristics, has caused investors to believe that the U.S. has also entered a new investment era to which the old guidelines no longer apply. Many have now come to believe that market risk is no longer a realistic consideration, while the risk of being underinvested or in cash and missing opportunities exceeds any other". This was a quote from Barons Magazine on February 3 1969 and seems to apply to things today.
Equity markets proved surprisingly resilient in 2023. In 2024, what factors will drive equity markets and investors’ portfolios?
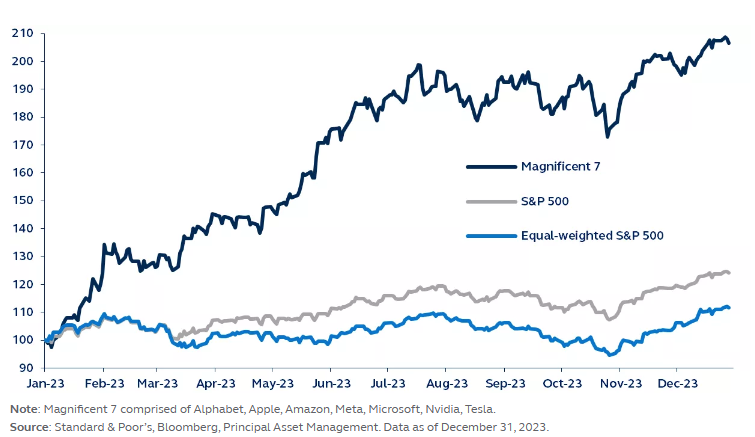
While the equity markets appeared strong in 2023, the story for the average stock was much different. By and large, the markets were driven by a handful of heavily weighted companies the Magnificent Seven, a group of mega-cap stocks that generated the overwhelming majority of return for the year. However, the rest of equities – particularly value equities – did not have such a great year. From a mathematical perspective, it was the biggest spread between growth and value stocks seen since the late 1990s.
So, what does that mean for 2024? With significant concentration into a few names, many interesting opportunities may be overlooked. For managers doing deep fundamental work, multiple opportunities exist across the equities landscape.
Below is the Magnificent 7 performance vs. S&P 500 equal-weighted and market-cap-weighted Calendar year 2023, rebased to 100 at January 1
One clear opportunity relates to continued advances in innovation across a swath of areas, including– biotech, artificial intelligence, semiconductors and semi-cap equipment, weight-loss drugs, robotics, and more. Capturing the beneficiaries of this rampant innovation will be critical to generating substantial returns in the future. However, this will also mean taking on risk, speculation.
There are many companies with solid balance sheets that are growing and generating healthy cash flows. Some are in cyclical industries, like energy and materials, while others are in financials and consumer. Many companies in these industries can generate strong growth and are attractively priced for their cash generation going forward. This may not be as sexy as investing in some of the opportunities that if they pop will generate huge returns, but for the older investor that is looking for more stability and income, we see ample opportunity to invest in equities over the next few years.The most important factor to take into consideration with your investment choices is your risk tolerance which should not be determined by a 6-8 question quiz.. Source David Kelly JP Morgan and George Maris Principal Financial
A Technical Perspective
Chart of the Week- Utilities
This week, we will discuss the Utilities sector ETF, XLU. Refer to the chart and corresponding, numbered points below.
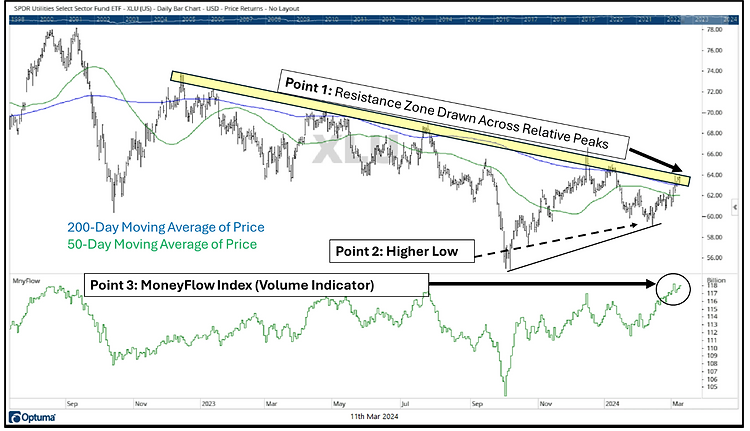
Point 1 shows a descending “resistance” zone. This is a zone where supply and demand shift. When price has reached this zone, supply takes over and causes a sell-off. Right now, price is intersecting this overhead resistance zone.
Point 2 establishes that the Utilities sector ETF recently set a higher low point. An uptrend often has a pattern of higher highs and higher lows. Prior to point 2, the sector was following a pattern of lower lows and lower highs. In other words, Utilities is attempting to establish a new trend.
Point 3 shows the MoneyFlow Index, which is a “smart” money indicator. Ideally, you want to see uptrends have higher volume. The MoneyFlow Index established a new high on the latest move, indicating that volume has been strong.
Currently, the Utilities sector ETF is at a zone of resistance. The sector has gone lower in previous instances after hitting resistance. However, Utilities recently set a higher low and has had stronger volume on the latest up move. While the sector is not yet a “buy,” this is positive.
The next FOMC meeting is scheduled for later this month. Many investors previously speculated that the Fed may look to lower interest rates at this meeting. Now, the Fed is expected to hold rates steady. While predicting the future is difficult, the Utilities sector can be interest rate sensitive. One way or the other, the Fed’s upcoming interest rate decision could have an impact on the sector’s movement.
While some large technology stocks have shown signs of weakening, market participation is broadening. It is interesting that tech stocks saw a historically large number of outflows last week, but it is not yet a concern for many technology-related stocks. We continue to monitor technology stocks for rising volatility and signs of new trends. Source Brandon Bischoff Canterbury Investments
The Week Ahead
At the time of this writing U.S. inflation updates are the main events on a sparse economic calendar this week. Tuesday’s headline CPI report is expected to show a flat +3.1% YoY for February, with the monthly reading ticking up to +0.4%. Core inflation is forecast to ease to +3.7% YoY from 3.9%. These readings would likely represent a mixed bag for the Fed’s upcoming March 20 meeting, which may lead to some revisions in the dot plot for interest rates.
U.S. PPI will be released Thursday, and inflation expectations will be part of March’s preliminary consumer sentiment reading on Friday. Both the New
York Fed and University of Michigan one-year inflation expectations have been stuck at a stubbornly high 3%. This week also features February’s retail sales report, which is expected to show a rebound from the prior month’s slide. Other U.S. data of note include 10- and 30-year Treasury auctions,
industrial production figures, and the Empire State Manufacturing Index. The only highlight on the international calendar is UK’s monthly employment update and wage figures. The labor market has been improving since October, easing recession concerns, but the Bank of England is unlikely to
consider rate cuts until there is further cooling of wage pressures
This article is provided by Gene Witt of FourStar Wealth Advisors, LLC (“FourStar” or the “Firm”) for general informational purposes only. This information is not considered to be an offer to buy or sell any securities or investments. Investing involves the risk of loss and investors should be prepared to bear potential losses. Investments should only be made after thorough review with your investment advisor, considering all factors including personal goals, needs and risk tolerance. FourStar is a SEC registered investment adviser that maintains a principal place of business in the State of Illinois. The Firm may only transact business in those states in which it is notice filed or qualifies for a corresponding exemption from such requirements. For information about FourStar’s registration status and business operations, please consult the Firm’s Form ADV disclosure documents, the most recent versions of which are available on the SEC’s Investment Adviser Public Disclosure website at www.adviserinfo.sec.gov/
The Optimized Investor
