Weekly Market Review
for September 11, 2023

The content of this Newsletter is to provide you with Economic insights to assist you in making better decisions with your investments. Unlike many other financial periodicals we will not mention specific companies, unless it is relevant to an overall economic issue. We welcome your questions on economic concerns and will address in our newsletter. just email us at info@optfinancialstrategies.com #FinancialAdvisor,#investmentmanagement #wealthmanagement #financialplanning #retirementplanning #401kplans
Week In Review
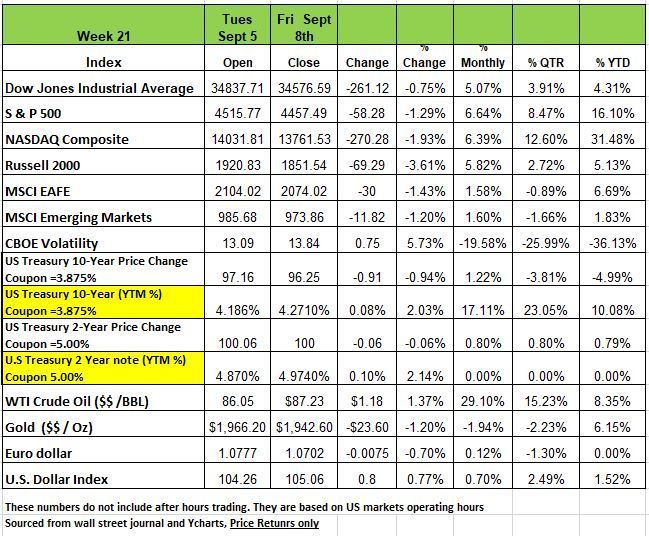
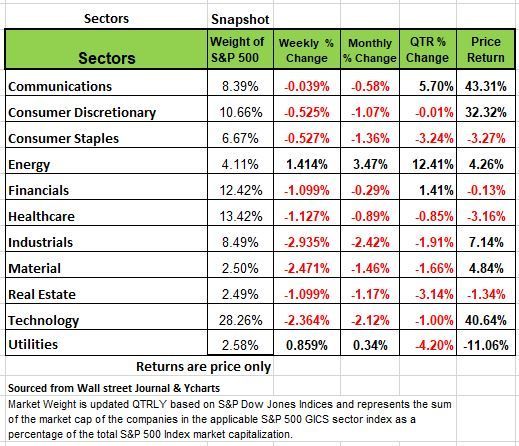
All four of the major indices were down last week with the Russell 2000 posting the largest decline of -3.61% followed by the NASDAQ -1.93% the S&P -1.3% and the DOW-.75% The declines were led by the industrial -2.93%, materials -2.47% & Technology-2.36% sectors,
The weekly move came in just four sessions as the US market was closed last Monday for the Labor Day holiday and Interest-rate concerns weighed on investor sentiment. The early September activity follows a negative month in August as investors have been pulling back in recent weeks from the optimism that drove strong gains in the first half of the year.
Investors have been focused on the Federal Reserve's next policy moves. The central bank's policy-setting committee isn't expected to raise rates at its meeting later this month, but speculation is increasing that it may raise rates at its late October/early November meeting. Inflation data for the month of August will be released on Wednesday morning and is expected to tick up slightly since oil prices increased by +3.2% in August. U.S. Treasury yields and the dollar climbed even as comments from a few FOMC policymakers indicated that further hikes this year may not be necessary
The industrial sector had the largest percentage drop this week, falling -2.9%, followed by a -2.4% decline in materials and a -2.3% slip in technology. However, two sectors managed rallies with energy up +1.4% and utilities climbing +0.9%.
The industrial decliners included Rollins (ROL), whose shares fell 8.3% on the week as a secondary stock offering priced at $35 per share, an 8% discount to the stock's prior closing price.
In the materials sector, shares of FMC Corp. (FMC) lost 12% amid a short-seller report that the agricultural sciences company disputed. FMC said the report, published by short-seller Blue Orca Capital, made "misleading and factually inaccurate statements regarding FMC's patents for its diamide insecticide technology and inaccurately speculated on the strength of FMC's business."
Apple (AAPL) shares weighed on the technology sector, falling almost 6%, amid reports that China ordered officials at central government agencies not to bring iPhones into the office or use them for work.
The energy sector's climb came as crude oil futures rose on the week. Gainers included shares of Marathon Petroleum (MPC), which rose 6.4% as analysts at Goldman Sachs, UBS and Wells Fargo raised their price targets on the stock.
As indicated in the chart above, 5 of the 15 top-performing subsectors, including the second-best performing subsector year-to-date (Semiconductors), came from the S&P 500 Information Technology sector. Consumer Discretionary had three subsectors represented, while Communication Services and Industrials each had two subsectors represented.
With respect to the 11 major sectors that comprise the S&P 500 Index, Communication Services posted the highest total return for the period captured in the chart, increasing by 44.32%,. The second and third[1]best performers were Information Technology and Consumer Discretionary, with total returns of 40.60% and 32.32%, respectively. The S&P 500 Index posted a total return of 17.43% for the period.
As of 9/8/23, the most heavily weighted sector in the S&P 500 Index was Information Technology at 27.92%, according to S&P Dow Jones Indices. For comparison, the Communication Services sector had a weighting of 8.85%.
Of the 11 major sectors that comprise the S&P 500 Index, Energy had the lowest estimated year-end price-to earnings (P/E) ratio (11.86 as of 8/31), according to S&P Dow Jones Indices. Financials were second-to-last with a year-end P/E ratio of 12.86. Not including Real Estate, Information Technology has the highest 2023 estimated P/E ratio for the sectors that comprise the S&P 500 Index, coming in at 30.81 as of 8/31.
Economy
There is no shortage of “experts” hitting the media circuit professing that inflation had passed in fact a month ago, with July’s CPI number many pundits as well as the markets were betting that the Fed had reached its objective and would cease raising rates. We have experienced 16 rates hikes over a 17-month period in addition we have seen the biggest drop in the M2 money supply since the Great Depression, the result, consumer prices rose 0.2% in July, with the year-over-year rate increase down to 3.2%, well below its 8.3% increase we experienced in August 2022.
But as Yogi Berra said “it ain’t over til its over”. Things change, consumers are spending and credit card balances are on the rise. Oil prices took a turn up in August +3.2% with both the Saudi’s and Russians cutting production. On Wednesday we will get the August CPI numbers to see how much it impacted all prices. We expect the August numbers will come in a bit hotter than July. If we are right, we believe that consumer prices rose 0.6% for the month, which would increase the YOU number to about 3.7% versus a year ago. This should be viewed as an acceleration.
Still, this is a a far cry from the Federal Reserve’s stated inflation goal of 2% and that the consumer is still spending means the job is not done yet. It’s already been 2 years since restrictions were lifted, so we don’t think it’s pent-up demand. But for many the excess cash that was placed in their bank accounts are close to being depleted. As the San Francisco Fed projected that the money should be spent by end of Sept. In addition, we think that there will be a spike in the unemployment numbers before the end of the year as those that left the workforce will be forced to reenter and find work since savings are depleted.
Leave it to the government to manipulate numbers in order to create a narrative that will mislead the public. Last November, the Fed invented something called “Super Core” inflation, dropping energy, food, and housing prices, but even this measure is up 4.7% in July versus a year ago, higher than the 4.4% when it was introduced.
This measure of inflation should be dismissed, it is nothing more than politics to show that something is working but we know better. Besides, the Cleveland Fed’s median PCE inflation rate is up 4.8% in the past year.
For those readers old enough to remember we are not back in the late 70’s early 80’s, but there are some similarities. The Great Society spending pushed government spending on a steep upward trajectory in the 1970s, in spite of the wind-down of the Vietnam War. Policymakers monetized much of this extra spending. The result, a pattern of big government which slowed growth, but boosted inflation from easy money policies. When Reagan and Volcker reversed these two policies, growth accelerated, while inflation fell, after going through a severe recession early in the 1980s. America got back on track.
Then we experienced the Great Recession and Financial Panic of 2008-09 governments response again was to throw more money at the problem, we had a big shift upward in spending and the economic recovery that followed was marginal. Policymakers again responded to COVID with more of the same, now adding higher debt and inflation to the mix. The solution is not to throw money at these economic challenges. The ideology of having successful business leaders pay for all of this by taxing more is another issue. At some point in time the wealthy will stop investing in businesses that create jobs and stimulate economic growth.
Lastly there is a growing number of voices calling for the Fed to raise its long-term inflation target from 2.0% to something closer to 3.0%. Of course, they know that more rate increases will eventually cause more fractures in the economy and hurt their investments. But this month the student loan payments are starting up again and we won’t know exactly how much of an impact that will have on the economy just yet, but we believe restaurants will take the biggest hit, if the spending habits are not changed. It may take this generation a little time to realize they have a new budget.
We expect the Fed will stick to its 2.0% inflation goal. Changing the target at this juncture risks severely undermining the Fed’s credibility.
Over the 10 years prior to COVID Inflation averaged 1.8%. It is highly unlikely that we will experience that low and average in the decade ahead, especially with the issues rising in China. Source Economist Brian Westbury
A Technical Perspective
This week we are taking a look at Energy Stocks and the Strength of Technology. We are now one week into the month of September. September is a historically weak month for the markets. September is the only month to have more negative returns than positive ones since 1950 (about 56% of Septembers since 1950 have been negative).
Seasonality can certainly have an impact on the markets. As seen last month, August is typically a low volume trading month. In this particular case, however, September being weaker is most likely a statistical anomaly and nothing more than a coincidence. The strength or weakness of a particular time frame, whether it be a day, month, year is largely dependent on a number of factors such as market volatility and market environment.
Sector Leadership
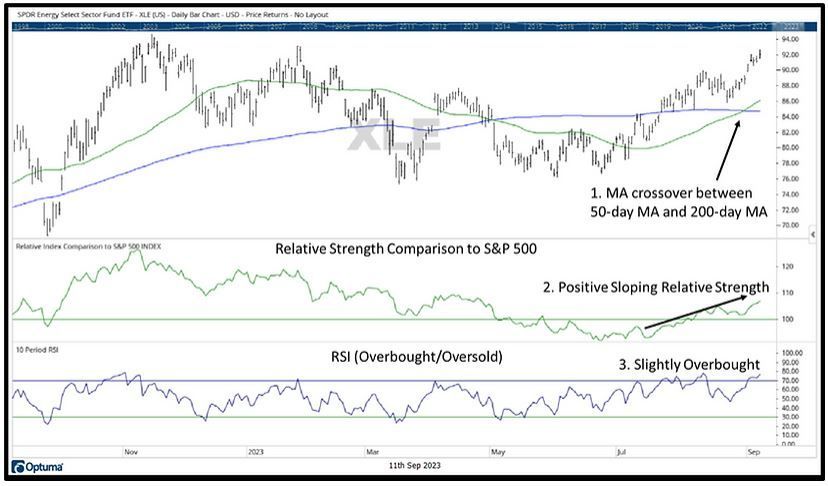
Gas prices have surged around the country. Whether it is a direct result or not, from a technical standpoint, the Energy sector is now the highest ranked S&P 500 sector on a risk adjusted basis. While most sectors declined in August and in the first week of September, the Energy sector had a low correlation to the rest of the market and experienced an upward trend. The chart below shows the energy sector ETF (XLE) with a few technical notes.

A few comments:
1. The 50-day moving average just crossed above the 200-day moving average. This is an indication of a positive trend.
2. Relative Strength is upward sloping. This means that compared to the S&P 500, Energy has been outperforming on a relative basis (either on the upside or downside or both).
3. RSI (overbought/oversold) is currently overbought. This is an indicator that measures the speed and magnitude of recent price changes. Right now, this indicator is showing that Energy is slightly overbought. Since Energy is overbought, it means that the sector has had a recent boost in momentum. This reading suggests that in the short term, there could be a slowdown in momentum or pullback to work off those overbought conditions, but the timing and extent of a potential pullback are unknown.
Technology Stocks
We have stated it many times this year, but the markets have largely been carried by technology-related stocks. The S&P 500 has significantly outperformed both the Dow Jones Industrial Average and the equal stock weighted S&P 500 this year, due to the S&P 500’s extreme skew towards large technology stocks. The largest eight technology-related stocks make up more than a quarter of the index’s market capitalization. That is 8 stocks, out of 505, making up 27% of the market index’s movements.
Each of the largest 8 stocks, which are Apple, Microsoft, Nvidia, Google (2 share classes), Amazon, Tesla, and Meta, are in the top 10% of S&P 500 performers this year. As a matter of fact, Nvidia, Meta, and Tesla are the top 3 S&P 500 performers in 2023 (these same stocks were some of the worst performers in 2022).
Although these large technology-related stocks are up significantly, more than half of the market’s components are flat or down on the year. The median S&P 500 stock is only up 2.9% year-to-date, and 45% of S&P 500 stocks are actually down. This puts the markets in a vulnerable position.
Most of this year’s market performance has come from the S&P 500’s largest technology-related stocks. The largest 8 stocks are in the top 10% of market performers, and a few of them, which were among the worst performers in 2022, have been the very best stocks 2023. While this is positive, the average S&P 500 stock is not doing nearly as well. The S&P 500 has outperformed the equal weight S&P 500 stock index by double digits.
The reason that this puts the market in a vulnerable position is because most of the index’s strength has been concentrated in just a few stocks. Just as these stocks have carried the market higher, they are also positioned to drag it down if they start to show signs of higher volatility. Markets have started to become a bit choppier lately. Source Brandon Bischoff
The Week Ahead
A busy week awaits with U.S. inflation figures on Wednesday, updates on China’s worsening economic situation, and the European Central Bank’s next interest rate decision. Wednesday’s U.S. CPI will be top of mind after last week’s stronger-than-expected services sector data fueled concerns of sticky inflation and thus a Fed willing to tolerate higher-for-longer interest rates. Prospects for above- trend growth should remain a thorn in equity bulls’ sides. Additionally, the ongoing selloff in U.S. Treasuries will have global investors gauging results of the 10- and 30-year auctions mid-week.
August Retail sales will arrive Thursday and may reflect increasing pricing pressures on U.S. consumers. The domestic agenda wraps up Friday with consumer sentiment, industrial production, and the New York region’s manufacturing survey. Overseas, the ECB faces one of its more uncertain rate decisions yet on Thursday, as inflation slowed in August but price risks remain skewed to the upside. Meanwhile, business conditions are deteriorating in Germany, the region’s largest economy. China releases industrial production and retail sales numbers as the country struggles with weak demand at home and from abroad. Other international announcements include the UK’s monthly GDP and employment updates, Eurozone economic sentiment, and Australia’s business confidence and jobs data.
This article is provided by Gene Witt of FourStar Wealth Advisors, LLC (“FourStar” or the “Firm”) for general informational purposes only. This information is not considered to be an offer to buy or sell any securities or investments. Investing involves the risk of loss and investors should be prepared to bear potential losses. Investments should only be made after thorough review with your investment advisor, considering all factors including personal goals, needs and risk tolerance. FourStar is a SEC registered investment adviser that maintains a principal place of business in the State of Illinois. The Firm may only transact business in those states in which it is notice filed or qualifies for a corresponding exemption from such requirements. For information about FourStar’s registration status and business operations, please consult the Firm’s Form ADV disclosure documents, the most recent versions of which are available on the SEC’s Investment Adviser Public Disclosure website at www.adviserinfo.sec.gov/


