
Weekly Market Review for November 6th, 2023

The content of this Newsletter is to provide you with Economic insights to assist you in making better decisions with your investments. Unlike many other financial periodicals we will not mention specific companies, unless it is relevant to an overall economic issue. We welcome your questions on economic concerns and will address in our newsletter. just email us at info@optfinancialstrategies.com #FinancialAdvisor,#investmentmanagement #wealthmanagement #financialplanning #retirementplanning #401kplans
Week In Review
This is our first market up date in several weeks as we have moved into aa new office and had some traveling that took us away from this newsletter. The markets have been volatile for the last several weeks, many experts are predicting that the government has reached it target interest rate and will cease rate hikes, we are not too sure of that scenario, in addition to that if a recession occurs in 2024 the markets are already pricing in rate cuts, even though Fed Chair Powell has made it clear that rates will remain higher for longer and said no plans for a rate cut in 2024. The narrative of the rate cuts has impacted the real estate sector, especially on housing. Many would be buyers are staying where they are thinking rates will drop next year. However the housing market varies throughout the country in the south such as Texas and Florida the demand is high enough that newly built homes are moving, however the northern areas such as northwest Indiana we are seeing homes sitting for longer periods, one reason could also be that they are over priced.
Last week all of four of the major indices sky rocketed with the Russell 2000 taking the largest jump at +7.56% followed by the NASDAQ with +6.61% the S&P500 +5.85% and the DOW with a +5.07% climb. This coming off of the previous 2 weeks of more than -2% negative returns each week.
On Tuesday, the S&P 500 closed out October with a monthly drop of -3.1%, marking its third consecutive monthly decline, on worries over whether the Federal Reserve might raise rates again to combat inflation.
However, on Wednesday, the stock market kicked off November with a rally as the FMOC held the target range for its federal funds rate steady and comments by Powell focused on progress on moving inflation lower. Investors saw that as a hint that the committee's rate increases may be ending.
The rally continued after data released Friday showed the US economy added fewer-than-expected jobs in October while the unemployment rate unexpectedly rose; the weaker-than-expected job growth is seen as reducing the likelihood of more rate increases, so the markets like the bad news thinking it will keep rates steady or drop in 2024.
Treasury yields dropped dramatically over the course of the week after the Federal Reserve Bank signaled a possible end to rate hikes and employment data supported this speculation. Yields began the week by rising on Monday and Tuesday as investors’ fears of a significant conflict in the Middle East subsided after Israel’s ground offensive had not been as intense as expected and the Bank of Japan only made minor changes to its policy settings. However, Treasury yields dropped significantly on Wednesday after the Fed meeting that saw no increase in the Federal Funds Rate. Fed Chairman Jerome Powell said that the tightening cycle has come far and that the Fed is “proceeding carefully.” He also implied that the increase in long-term Treasury yields in the open market has reduced the need for the Fed to increase the Federal Funds Rate again. Yields dropped significantly again on Friday as the October Change in Nonfarm Payrolls came in at 150k, which was below consensus expectations of 180k, but still in a range that suggest the economy is not running hot enough for the Fed to have to increase interest rates again. The market implied probability of an interest rate hike during either the December or January meetings dropped from 27.5% at the beginning of the week to 10.8% by the end of the week. The market implied rate by the end of 2024 also dropped from 4.57 to 4.345. Oil prices dropped 6% over the course of the week on the reduced expectations for expanded regional conflict in the middle east and slowing global demand.
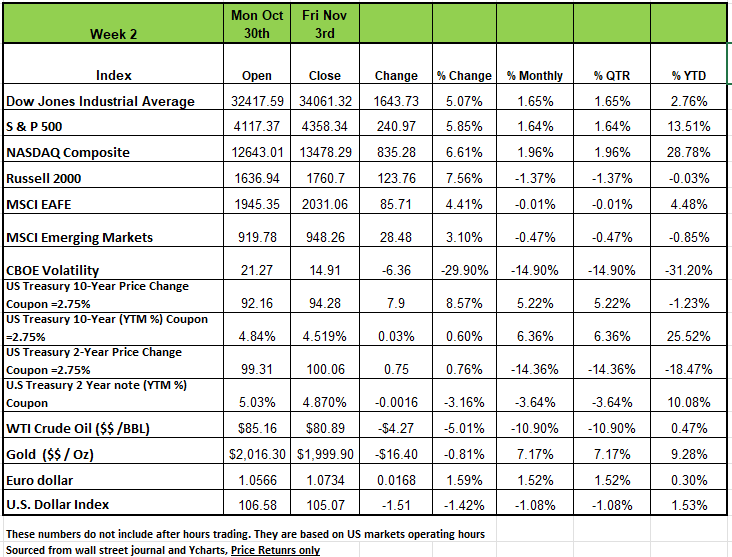
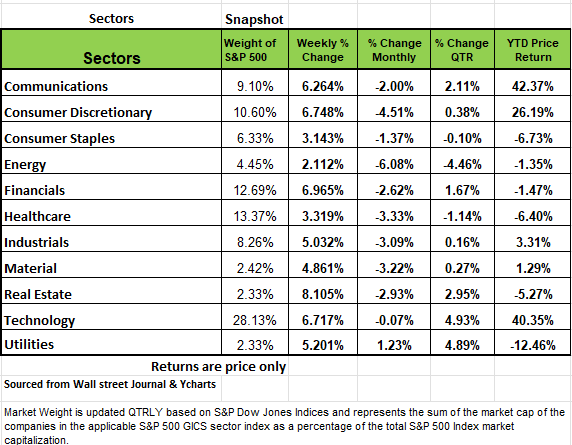
All of the sectors rose week-to-week, led by an +8.1% jump in real estate, a +7% rise in financials and a +6.7% increase in consumer discretionary. The smallest increase was logged by energy, which still rose +2.1%.
The climb in real estate included shares of Simon Property Group (SPG), which had a 13% weekly increase as the shopping mall operator posted Q3 funds from operations and revenue above analysts' expectations and raised its guidance for full-year funds from operations.
In the financial sector, shares of Assurant (AIZ) jumped 12% as the business services company reported Q3 results above analysts' expectations.
In consumer discretionary, Garmin (GRMN) shares climbed 16% as the navigation device company reported Q3 adjusted earnings and sales above Street views and raised its full-year guidance.
Banking Climate
Two weeks ago, the yield on the 10-year Treasury Note was hovering around 5%, and the S&P 500 was in contraction territory, down over 10%. But last week, the 10-year yield dipped to 4.6%, while the S&P 500 saw a 6% gain. This market volatility is attributed to changing sentiments:
First, there was a belief that the Federal Reserve had lost control, but now,
Second, it seems the Fed has achieved a "soft landing," bringing a semblance of stability.
But these are short term interpretations and the economic cycle has not been completed. While this may hold some truth, we remain cautious. If we step back and look at the US economy from a distance, things don’t really look all that great to us. Our concerns go all the way back in 2008, when the Fed altered its approach to monetary policy. The Fed shifted from a "scarce reserve" model to an "abundant reserve" model when it initiated Quantitative Easing, fundamentally changing how interest rates are determined.
In the past, banks occasionally lacked the reserves they were legally required to hold, prompting them to borrow from other banks with excess reserves through their federal funds trading desks, thus determining the federal funds rate through an active market. Today, banks are flush with trillions of excess reserves, eliminating the need for borrowing and lending reserves. Consequently, the federal funds trading desk has become useless.
This leads us to think that banks are not creating a market for federal funds, so then were does the rate come from? It seems like the answer is that the Fed just makes it up. Literally makes it up. And, over the past fifteen years, the Fed has held the funds rate below inflation 83% of the time.
The last time the Fed kept rates artificially low was in the 1970s. The result was inflation, but even more importantly, banks and Savings & Loans lent at rates lower than they should have. The ultimate result was the dramatic downfall of the S&L industry, along with many banks, as the losses incurred from offering high interest rates to depositors while getting low rates from borrowers steadily eroded their capital.
Today, US commercial banks carry an estimated $650 billion loss in their “held to maturity” assets The Treasuries they purchased while rates were abnormally low don’t have to mark them to market unless they need to access those funds like Silicon Valley Bank did earlier in the year. Remember that outcome?
What the Fed will do is pay these private banks and other institutions roughly $300 billion this year just to hold reserves. Another nice way for the government to increase taxpayer liability. Without this payment from the Fed to the banks, profits would be much lower and the losses on their books would be more painful.
Our point we are making is that the Fed has made a mess of the banking system. While we've averted major crises thus far, it's the taxpayers who ultimately bears the burden. The $300 billion the Fed pays to banks doesn't appear out of thin air, and unless interest rates decrease significantly, these losses will accumulate.
Like the 1970s and 1980s – because we don’t have mark-to-market accounting on these held-to-maturity assets – the banks can eventually earn their way out of this abyss. So, this doesn’t mean the economy will suffer, other than the fact that banks have less ability to make new loans.
This is exacerbated by the Fed engineering a decline in the M2 measure of money, which has fallen by 3.6% in the past year. Some of this decline is because since 2008 the Treasury Department has started holding a great deal of cash in its checking account at the Fed. For decades it held just $5 billion as a cash management tool. This number soared after QE started, and as of November 1, 2023, the Treasury General Account (TGA) at the Fed held $820 billion. This money is part of the Fed’s balance sheet, but does not count as M2. So, when the Treasury borrows from, or taxes the private sector, and then puts that money aside in its own TGA, it will lower M2. Basically, the Treasury has helped engineer a decline in M2. The Treasury could use this $820 billion to reduce debt, but it hasn’t, and taxpayers will pay roughly $40 billion per year in interest, just so the Treasury/Fed can hold this cash. That makes a lot of sense, right? NO!
This new method of managing monetary policy appears fraught with risks. Instead of stabilizing banks, it has introduced instability, proved costly to taxpayers, and contributed to the worst inflation since the 1970s.
Over the short term it appears things will be ok, but the idea that everything will turn out perfectly over the long term seems like wishful thinking. The government has expanded significantly since 2008, with federal government spending growing from 19% of GDP in 2007 to 25% last year, and the Fed's balance sheet has expanded from 6% of GDP in 2007 to 33% of GDP.
It seems evident that the US government has manipulated markets for the short-term political agenda.
Source Economist Brian Westbury PhD
A Technical Perspective
For those new readers to our newsletter technical analysis is an investment strategy /trading discipline that relies on identifying opportunities by analyzing statistical trends gathered from trading activity, such as price movement and volume. While no one can identify the bottom and peak price of a security, technical analysis tries to identify opportunities close to it.
Heading into last week, many major market indexes had entered “oversold” conditions. In other words, markets had declined to a point where they were “due” for a kickback rally. This has happened two other times in recent months, and in both cases, the rally fell short of being meaningful. Will this kickback be any different?
The market’s few “up” days last week were greater than most investors would have predicted. The kickback began on Wednesday as investors speculated that the Federal Reserve would be done raising interest rates for the year. This optimism continued into the end of the week.
So far, this recent market move has not started a new trend. As of this writing, the markets are still in a pattern over lower highs and lower lows that began in August. Maybe this trend will be broken, but there are a few concerns. These concerns are bulleted out below.
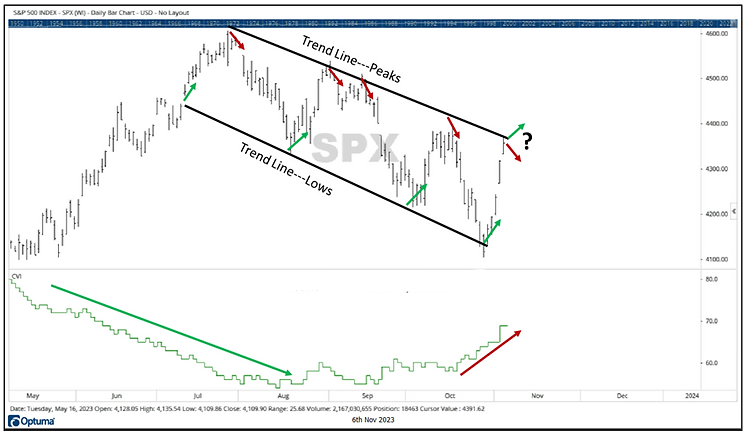
The S&P 500 is trading in a clear channel of lower highs and lower lows. The chart above draws trend lines across previous highs and previous lows. Right now, the current price is at the upper end of the channel. This would typically be a point of resistance, or a level where some selling may occur.
The lower half of the chart shows the Volatility Index (VI). Declining volatility is an efficient or “normal” market characteristic. Rising volatility is a sign of an inefficient or “irrational” market. Since the beginning of August, volatility has been rising. Volatility showed a sharp rise last week during the market’s advance. So, the kickback rally has not appeared to be rational.
The S&P 500 has been one of the strongest indexes in 2023 due to its heavy weighting towards a few larger stocks. Readers of our updates will be familiar with those stocks. On the other hand, the Russell 2000 (an index of small cap stocks) has been one of the weakest indexes and is in a long-term bear market. After surpassing last year’s lows, the Russell 2000 experienced the strongest advance last week, and featured two outlier days beyond +2.6%. Keep in mind that large, single-day advances that occur back-to-back are typical during a bear market.
In addition to weak small cap stocks seeing the largest short-term rally, the S&P 500’s weakest sectors also saw the largest kickbacks. Real Estate and Consumer Discretionary saw the strongest upward moves last week. These two sectors had previously been the market’s worst performers during the decline seen from August to October.
Last week, markets saw a kickback rally that was fueled by investor hopes about the Fed’s interest rate decisions. Hope is not a sound investment indicator. For the moment, this rally has yet to break the market’s trend of lower highs and lower lows. The weakest areas saw the biggest bounce. Those areas are in bear markets. Sharp, short-term rebounds are typical and expected during bear markets.
From a portfolio management perspective, there have not been many “conservative” areas in the markets. We have discussed in previous updates that bonds are in bear markets, and if interest rates do continue to rise, bond prices will continue to decline. Remember that price and yield are inversely related. Source Brandon Bischoff
The Week Ahead
Risks still remain, even after last week’s interest rate plunge which sent stocks soaring, investors might have a chance to catch their breath. The surge caused both Whaley and Zweig breadth thrusts, two rare
technical events that often are associated with historically stronger-than-normal forward equity
returns.
Oil prices eased as the geopolitical risk premium waned. This week’s economic calendar is light, and U.S. earnings season is in the rearview. Most of this week’s data comes from Europe, with German manufacturing numbers as well as producer prices and retail sales from the wider euro zone. In the U.S., attention will be focused on Treasury auctions on Wednesday and Thursday as oversupply concerns may be fading.
Fed Chair Powell is scheduled to speak those same days in Washington, D.C. Consumer credit and trade balance figures arrive earlier in the week, while November’s preliminary consumer sentiment and inflation expectations complete the domestic agenda. Overseas, Australia’s central bank meets later tonight, and contrary to the rest of the world, recent inflation data suggests that an interest rate hike may be in the offing. China’s central government has hinted recently that fiscal spending may increase, so this week’s trade data, new loans, and inflation figures will be closely monitored. Lastly, Friday’s UK GDP release will likely show a slip into contraction as the economy suffers job losses and weak demand.
This article is provided by Gene Witt of FourStar Wealth Advisors, LLC (“FourStar” or the “Firm”) for general informational purposes only. This information is not considered to be an offer to buy or sell any securities or investments. Investing involves the risk of loss and investors should be prepared to bear potential losses. Investments should only be made after thorough review with your investment advisor, considering all factors including personal goals, needs and risk tolerance. FourStar is a SEC registered investment adviser that maintains a principal place of business in the State of Illinois. The Firm may only transact business in those states in which it is notice filed or qualifies for a corresponding exemption from such requirements. For information about FourStar’s registration status and business operations, please consult the Firm’s Form ADV disclosure documents, the most recent versions of which are available on the SEC’s Investment Adviser Public Disclosure website at www.adviserinfo.sec.gov/
The Optimized Investor
