
Weekly Market Review
for December 5th, 2023

The content of this Newsletter is to provide you with Economic insights to assist you in making better decisions with your investments. Unlike many other financial periodicals we will not mention specific companies, unless it is relevant to an overall economic issue. We welcome your questions on economic concerns and will address in our newsletter. just email us at info@optfinancialstrategies.com #FinancialAdvisor,#investmentmanagement #wealthmanagement #financialplanning #retirementplanning #401kplans
Week In Review
All four of the major indices ended the week up last week with the Russell 2000 posting a return of +3.05% followed by the DOW with a +2.4% return the S&P500 +.077% and the NASDAQ +0.38%
The big news was the monthly perfo9rmance by each of the indices with the NASDAQ returning +17.45% followed by the S&P 500 with a +12.29% return and the DOW with a +11.852% return. Only the Russell 2000 post a negative return for the month of November with a -3.92% decline. November was the Strongest month in more than a year as inflation data seems to have been stabilized and showing a decline while the Fed continued to hold interest rates at current levels.
The S&P 500 is now beginning the final month of the year with year-to-date gains just shy of 20%. Treasury yields declined across the board last week following a batch of mixed economic data. New single-family home sales declined 5.6% in October, taking a breather following a gain in September. With 30-year mortgage rates currently sitting above 7.5%, financing costs continues to remain a headwind. Real GDP was revised upward for the third quarter to a 5.2% annual rate from a prior estimate of 4.9%. This marks the fastest quarter of growth since 2021. Upward revisions to business investment, home building, government purchases and inventories more than offset a downward revision to personal consumption. Both personal income and consumer spending rose 0.2% in October, matching consensus expectations. While incomes and spending continue to grow, they’re growing at a more modest pace than in recent months. The ISM Manufacturing Index remained at 46.7 in November, falling short of the consensus expected 47.8. The US manufacturing sector contracted once again in November for the thirteenth consecutive month, the longest streak since the aftermath of the 2000-2001 recession.
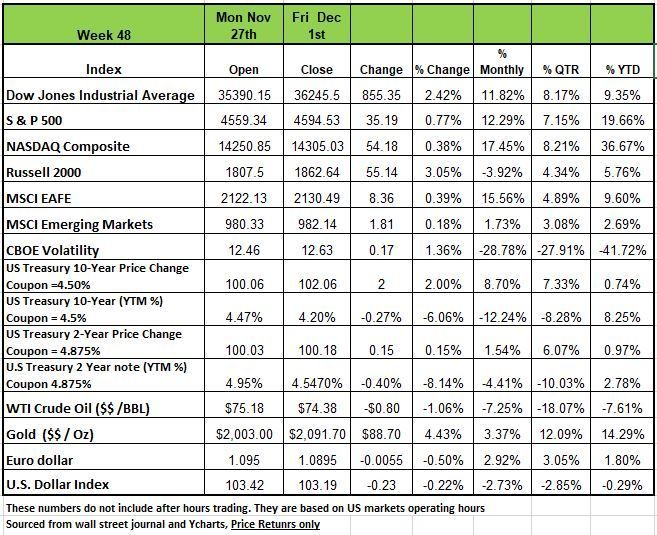
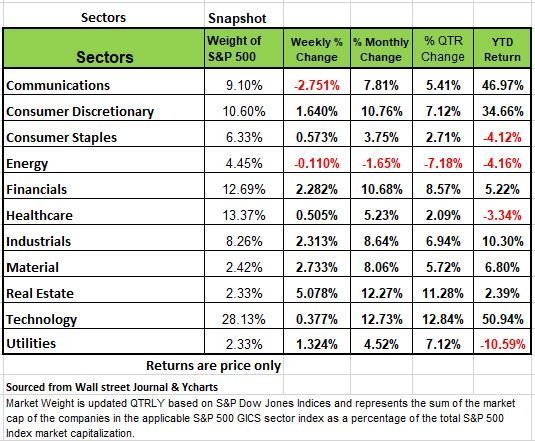
By Sector, last week's climb was led by the real estate sector, which rose 4.6%, followed by a 2.6% gain in materials and a 2.1% rise in industrials. Other gainers included financials, consumer discretionary, utilities, consumer staples, health care and technology. Two sectors ended the week in the red: communication services fell 2.5% while energy eased 0.1%.
In the real estate sector, shares of Crown Castle (CCI) rose more than 14% this week as investor Elliott Investment Management called on the communications infrastructure real estate investment trust to make leadership changes and undertake a review of its fiber business, among other measures, citing the company's "history of underperformance."
The materials sector's gainers included shares of Packaging Corp of America (PKG), which climbed 9.4% as Wells Fargo increased its price target on the containerboard company's stock to $173 each from $147. Wells Fargo kept its rating on the shares at equal weight.
The decliners in communication services included shares of Google parent Alphabet (GOOGL) amid a report that Microsoft (MSFT) is looking to set up its own mobile app store in a bid to challenge the dominance of Alphabet and Apple (AAPL). Alphabet's Class A shares fell 3.5%.
Next week, a number of economic reports will be released with November's nonfarm payrolls and unemployment rate, due Friday, expected to garner the most attention.
Careful of which narrative you listen to
There is enough noise out there to confuse the most seasoned of investors. Much of this is coming from those mostly trying to grab attention for themselves and grab more assets from potential clients. To be honest this newsletter is developed to provide insight first to our readers and also to attract new relationships.
We are not trying to be either optimistic or pessimistic in our view of the economy just as objective as possible and we tend to err on the side of caution more often that maybe others. So here is what we see
Cracks are beginning to appear in the economy’s foundation this is a result of a monetary policy of high interest rates and a shrinkage of the money supply after a 10 year period of interest free money and excess supply. The Fed has continued to suggest that rates will remain Higher For Longer, they are not taking about rate cuts but just because we had 10 years on abnormal interest rates does not mean that we should go back to that without justification.
One of the issues that has occurred over the last decade is the Fed’s desire to become “transparent,” and making public the dot-plots, the individual projections of interest rates by Federal Open Market Committee (FOMC) members, and allowing those members to publicly discuss their individual economic projections and what that would mean for policy. Prior to the 2008 financial crisis no one knew what was going to happen or tried to make predictions like they do today
Since the adoption of “transparency,” the Fed assumed the difficult task of managing market expectations, and it must now be cognizant of any FOMC member comments which might reflect on policy. This was specifically noted by the Financial Times on Friday (December 1st) in a story by Colby Smith entitled “Fed shies away from talk of interest rate cuts.”
The hesitation to officially … address more directly the parameters for rate cuts, stems in part from fear that doing so could unleash a wave of looser financial conditions.”
The fact that FOMC members, in recent public comments, have acknowledged that monetary policy appears to be working (the recent inflation data have come in lower than anticipated) has been interpreted by markets to mean that the peak in interest rates is in, and that the next policy move will be to lower rates. Wall Street’s odds for this have recently moved from a rate cut at the 2024 June 12th meetings to the May 1st conclave. the yield on the 10-Yr. Treasury has come full cycle from early September to December 1st. At the Fed’s September meetings, in order to manage market expectations so that financial conditions stayed tight, the Fed emphasized its Higher for Longer mantra. And that caused the 10-Yr. Treasury yield to spike from 4.2% to 5.0% by late October. Since then, as inflation has melted and FOMC public comments have acknowledged that additional rate hikes are improbable, 10-Yr. yields have returned to that 4.2% level where they were prior to September’s (Higher for Longer) meeting.
The FOMC still believes, or feels it must act like it believes, that the war on inflation hasn’t yet been won, and it wants to keep rates at highly restrictive levels. But the financial markets aren’t cooperating both because the inflation data has come in well below expectations, and because it detects from FOMC member speeches that the Fed is done hiking. Historically, the first rate cut comes 10 months after the last rate hike which was July 26th. That puts the bullseye on the May 2024 meeting. But all this could change with holiday spending especially if companies think 2024 will see a recession.
Lets take a look at some of the areas that impact things
Housing
Housing is a key component of the economy, and the news there is not good. Pending Home Sales (new contracts) fell -1.5% in October, and this series is down -6.6% from a year earlier. Of significance, its current level is the lowest in the history of the series which began in 2001. This series is the precursor to Existing Home Sales, which are the completed sales contracts. Keep in mind again that different regions of the country have different housing challenges such as Florida which has a shortage with the number of people moving there.
Pending Sales and Existing Home Sales fell in October (-4.1%) from September levels (and September fell -2.2% from August). October’s number was a 13 year low. Looking back a year, sales are off -14.6%. We are now seeing the beginning of an impact on home prices, as the median sales price was off -0.3%,
This makes sense for many because most homeowners have mortgage rates in the 3%-4% range, current mortgage rates (mid-7% range, down from 8% in October) have driven inventories of existing homes for sale to record lows. As a result, those who have the means and desire to purchase have flocked to the New Home market. Even there, it isn’t an easy sell new home prices are down more than -17% year over year. That, and some buy down of the mortgage rate, is what it is taking to complete sales in this market. And that -17% is yet another sign that inflation is on the wane.
Beige Book
The Beige Book is a compendium of details about economic conditions in each of the 12 Federal Reserve districts. The latest release was, to say the least, downbeat on the economic climate. Four of the districts said economic growth was “modest,” while the other eight noted that conditions were flat or slightly down. Unlike recent such reports, no district reported any real economic growth nor any prospect thereof. As far as the immediate prospects for holiday retail sales, the Beige Book reported: rising price sensitivity; increased discounting, and consumer budget consciousness.
Retail
Holiday retail sales, initial reports from Black Friday and Cyber Monday indicate that there was a significant increase in customers choosing the buy now, pay later option when buying online, up 19% from a year ago. This looks to be an indication of some strain showing up in consumer budgets.
Challenger, Gray and Christmas employment specialist firm indicated that plans for seasonal holiday hiring is the lowest in a decade, down -40% from that of 2021. This would indicate that retailers are bracing for slow holiday sales. Best Buy, Kohl’s, Nordstrom, and Lowe’s all reported slumping same store sales in Q3, signaled no pick-up on the horizon, and cut previous guidance for 2023. According to Rosenberg Research, with all but a handful of S&P 500 companies reporting Q3 results, it says a lot about cracks in the foundation when 72% missed on top line revenue and 59% on earnings.
Manufacturing
The latest Manufacturing PMI Indexes from the Dallas and Richmond Feds both continued to show contraction. Dallas’ was -19.9 in November, and that despite record high energy production in Texas. New Orders, Shipments, Production, and the Workweek all fell from their October levels. And, while Employment was positive (+5.0), it was off significantly from its reading of two months earlier, i.e., September (+13.6). Three of the four inflation markers were more negative in November than they were in October.
· Backlogs: -18.1 vs. -12.9 and the lowest since early in the pandemic (April ’20)
· Delivery Times: -8.1 vs. -7.8
· Prices Received: -6.2 vs. -2.1
· Prices Paid: While still rising (+12.6), they were down from +25.0 just two months earlier.
The Richmond Fed’s data were similar. The overall index was -5; Backlogs and Shipments were down and Employment flatlined. Both Prices Paid and Received rose (+3% and 2% respectively), but at a much slower pace than the near 10% rate of a year earlier.
As in the U.S., the Manufacturing PMIs for all the major European countries (UK, Germany, France, Italy, Spain) were also in contraction, with the aggregate overall Euro area showing up at 44.2 in November (below 50 is contraction) after a 43.1 print in October. However, we will note that November will probably see a bump and by the time you are reading this newsletter the number will be released
It is unfortunate that the primary inflation measure is a 12 month look-back (i.e., the 3.2% headline for October uses October ’22 as its base) instead of shorter 3- to 6 -month periods which gives a better reading of what is currently occurring. Using shorter periods also allows better policy responses. In addition, there is a widely known and well recognized flaw in the shelter component (33% weight) of the CPI since the Fed uses opinions from homes owners on what they would rent their home for if they needed to.
There continues to be a rise in delinquencies in auto and other consumer loan categories, the consumer is using every available avenue to continue spending (record high credit card balances, and, buy now pay later products that most do not realize the actual cost involved in their purchase. It also leads to longer-term financial problems. But as long as the consumer can spend beyond their means things will look like they’re healthy.
Source Economist Bob Barone PhD.
A Technical Perspective
For those new readers to our newsletter technical analysis is an investment strategy /trading discipline that relies on identifying opportunities by analyzing statistical trends gathered from trading activity, such as price movement and volume. While no one can identify the bottom and peak price of a security, technical analysis tries to identify opportunities close to it.
As we have seen over the past three months, emotional and volatile markets will go in both directions, when least expected. This Investor Insights update will focus on two current market risks, one from a psychological perspective, and one from a technical perspective.
Risk #1: Investor Psychology- Bearish Sentiment is at a six-year low.
Markets often reflect investor emotions. Most of the time, investors act rational, and the result is a stable market. Other times, investors are irrational, and the result is a volatile bear market. During volatile markets, investor emotions will fluctuate between extreme optimism and extreme pessimism.
Investor emotions continue to fluctuate between extremes. look at the Sentiment Survey. Investor sentiment is a contrarian indicator. According to the American Association Individual Investors, which produces the survey, “a contrarian indicator tells investors that it may be a good time to go in the opposite direction of the herd.”
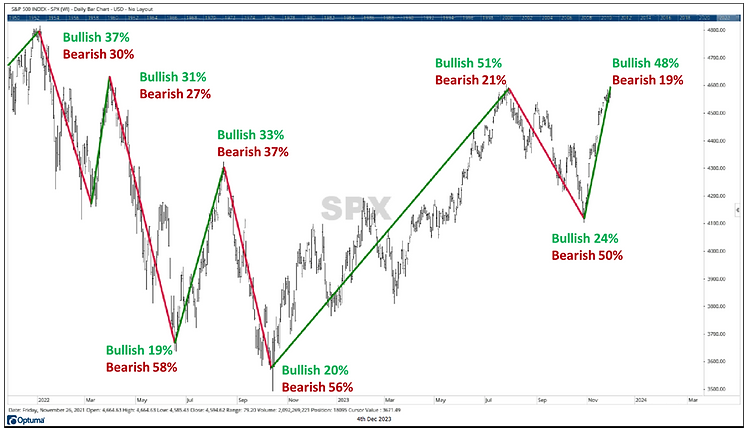
The latest survey results, which are published each Thursday, showed that 48% of investors currently have a positive outlook on the markets, and only 19% of those surveyed had a pessimistic outlook. Here is a quote from the AAII Sentiment Survey Commentary:
“Optimism among individual investors about the short-term outlook for stocks continued to rise in the latest AAII Sentiment Survey. Meanwhile, pessimism decreased to its lowest level in almost six years. Both types of readings have historically been followed by below-average and below-median six-month returns for the S&P 500 index.”
-AAII Investor Sentiment Survey Commentary (Published Nov 30th, 2023)
Pessimism is at its lowest level since January 2018, while optimism is unusually high and just a few percentage points off from its high for the last year. Since the beginning of 2022, investor sentiment has fluctuated between the two extremes, with high optimism/low pessimism preceding declines, and low optimism/high pessimism preceding rallies.
In the chart below, you can see market sentiment at relative peaks and troughs since the beginning of 2022. For reference, during normal bull market years, bullish (positive) and bearish (negative) sentiment have tended to be more balanced. The historical average for each is in the 30-40% range (as it was at the market’s peak near the end of 2021).
Risk #2: Technical- Many stocks are “overbought”
In markets and liquid securities, we use the terms “overbought” and “oversold” to identify potential pivot points. An “overbought” stock or market is one that has come too far, too fast and is likely to sell off to some degree. An “oversold” stock or market is one that is the opposite it has declined to the point where it is likely to see a bounce.
According to the Relative Strength Index (RSI), which is a technical indicator that measures overbought and oversold conditions, many major indexes are showing overbought conditions. Prior to November’s bounce, this same indicator showed that these indexes were oversold. For the S&P 500 and equal weight S&P 500, the overbought conditions have occurred one other time in 2023, and that was right around the indices’ peak in July, prior to markets declining.
Additionally, many individual stocks are displaying overbought conditions. In fact, looking at the S&P 1500, 20% of its components are overbought. This is the largest percentage of overbought stocks since February. These conditions increase the likelihood of a pullback to relieve some of the overbought pressure.
As Yogi Berra once said, “it's tough to make predictions, especially about the future.” Markets just experienced a -10%+ decline followed by a snap-back rally. Neither one of those moves is very efficient and goes further to highlight the risks in today’s market. Source Brandon Bischoff
The Week Ahead
A busy week awaits, with mostly second-tier economic data on the calendar. In the U.S., the main events will be consumer confidence on Tuesday and the Core PCE Price Index on Friday. Americans may be feeling more cautious as the holiday shopping season kicks off, as inflation has been falling but remains stubbornly high. The results from Black Friday should provide insights into discretionary spending patterns. Fresh housing data arrives this week, with new and pending home sales along with the housing price index. Mortgage applications rose 4% last week as rates fell to two-month lows, but volume is still down 20% YoY. Other U.S. releases include the second estimate of Q3 GDP, trade balance figures, personal income and spending numbers, and the ISM manufacturing survey results. Overseas, OPEC’s postponed meeting is now scheduled for Thursday, and additional production cuts may be in the offering to support slumping oil prices. In Asia, China’s official PMI surveys will be posted late Wednesday, while Japan’s core CPI reading lands a day earlier. To conclude, the European docket is focused on November’s preliminary inflation reports, with Germany on Wednesday and the wider Eurozone a day later.
This article is provided by Gene Witt of FourStar Wealth Advisors, LLC (“FourStar” or the “Firm”) for general informational purposes only. This information is not considered to be an offer to buy or sell any securities or investments. Investing involves the risk of loss and investors should be prepared to bear potential losses. Investments should only be made after thorough review with your investment advisor, considering all factors including personal goals, needs and risk tolerance. FourStar is a SEC registered investment adviser that maintains a principal place of business in the State of Illinois. The Firm may only transact business in those states in which it is notice filed or qualifies for a corresponding exemption from such requirements. For information about FourStar’s registration status and business operations, please consult the Firm’s Form ADV disclosure documents, the most recent versions of which are available on the SEC’s Investment Adviser Public Disclosure website at www.adviserinfo.sec.gov/
The Optimized Investor
