
Weekly Market Review
for November 20, 2023

The content of this Newsletter is to provide you with Economic insights to assist you in making better decisions with your investments. Unlike many other financial periodicals we will not mention specific companies, unless it is relevant to an overall economic issue. We welcome your questions on economic concerns and will address in our newsletter. just email us at info@optfinancialstrategies.com #FinancialAdvisor,#investmentmanagement #wealthmanagement #financialplanning #retirementplanning #401kplans
Week In Review
All four of the major indices were up last week, extending the markets winning streak, as investors were encouraged by cooler-than-expected October inflation data and stronger-than-expected quarterly results from some retailers. The Russell 2000 led the way with a +5.43% price return followed by the NASDAQ 100 with +2.37% the S&P 500 +2.24% and the DOW +1.94%
As you can see from the chart below all of the indices saw major gains for the month of November
Basically, taking back the declines seen over the last 2 months.
The advances came as economic data showed consumer prices as well as producer prices were tamer than expected last month, helping ease investors' worries about inflation and another interest rate increase by the Fed. Treasury yields were down so investors were moving toward Treasuries on the week driving down yields again suggesting that inflation in the U.S is done and the Fed may be able to stop hiking rates. Making the current Coupon treasuries more valued when coupons drop next year
The data showed US seasonally adjusted consumer price index, a closely followed measure of inflation, slowed to a flat reading in October, missing expectations for a 0.1% gain. Core CPI, which excludes food and energy prices, rose by 0.2%, smaller than the consensus estimate for a 0.3% increase.
The US producer price index, meanwhile, fell 0.5% sequentially last month on a seasonally adjusted basis when a 0.1% increase was expected. Excluding food and energy, monthly PPI was flat month over month after rising 0.2% in September and was below the 0.3% gain analysts had modeled.
Investors were also encouraged by stronger-than-expected quarterly reports from companies including Target (TGT) and Home Depot (HD) even as the retailers' sales declined year over year.
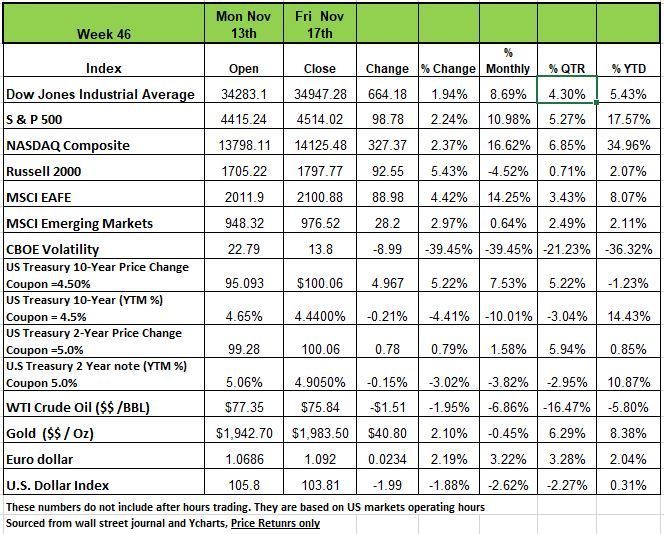
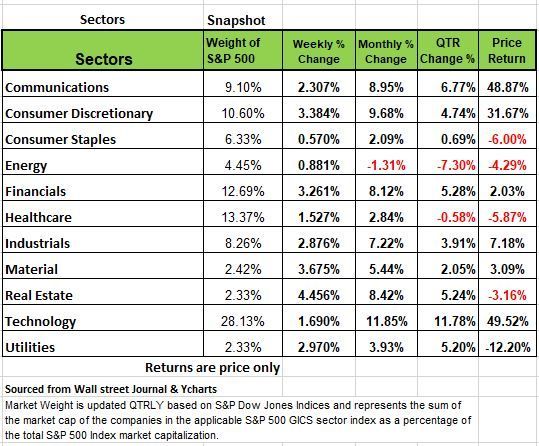
By Sector all of the S&P 500's sectors rose this week, led by a 4.5% jump in real estate, a 3.7% climb in materials and a 3.4% rise in consumer discretionary.
The real estate sector's gainers included Extra Space Storage (EXR), which declared a Q4 dividend of $1.62 per share, maintaining its quarterly rate. Shares of the self-storage real estate investment trust rose 7.7% on the week.
In the materials sector, shares of Mosaic (MOS) climbed 7.5% as Barclays upgraded its investment rating on the fertilizer maker's stock to overweight from underweight and increased its price target on the shares to $142 each from $140.
The top percentage gainers in the consumer discretionary sector included cruise operators Carnival (CCL) and Norwegian Cruise Line Holdings (NCL), up 16% and 13%, respectively.
This week is expected to be a lighter week due to the Thanksgiving Day holiday on Thursday. The US stock market will be closed all day and will close early on Friday for a shorter week of trading.
Economic reports anticipated ahead of the holiday-related closures include October US leading economic indicators today, Monday, October existing home sales on Tuesday and October durable goods orders on Wednesday. Also, minutes from the latest Federal Open Market Committee meeting will be released on Tuesday.
So where is that Recession everyone has been talking about
You are probably tired of hearing all the pundits’ views on the U.S Economy. Hard Landing Soft Landing, Recession in 2023 now in 2024 those same professionals including us thought we would have a recession in 2023 and considering we had 2 negative quarters of growth in the first half 2022. However, the NBER still did not release any information on the state of the economy so no recession was called.
You may also be hearing a lot of people talking about interest rate cuts in early 2024, so what is the rationale behind most of this. For one the Fed will not cut rates until it sees a weaking in the economy and since GDP is no longer a measure of strength it seems like unemployment will be the actual metric that it focuses on.
Let’s take a look at some of the economic data we know already and see if we might be able to paint a picture of where things are heading
The recent employment data may provide some evidence to where things are heading. October was the first month in a while to show employment weakness. When the revisions (-101K) and Birth/Death model add-on (+127K) are accounted for, the payrolls were actually negative in the Establishment Survey. The Household Survey, which wasn’t mentioned anywhere in the media, registered -348K net jobs. And if it weren’t for the fall in the Labor Force Participation Rate (discouraged applicants), the U3 Unemployment Rate would have risen more than the +0.1% point that brought it to 3.9% (the low was 3.4% last December). Over the last 7 decades, a rise of 0.5 percentage points in U3 has signaled a Recession 100% of the time. So, those that believe in the “soft-landing” scenario must also believe that “this time is different. As Warren Buffet famously said: “What we learn from history is that people don’t learn from history.”
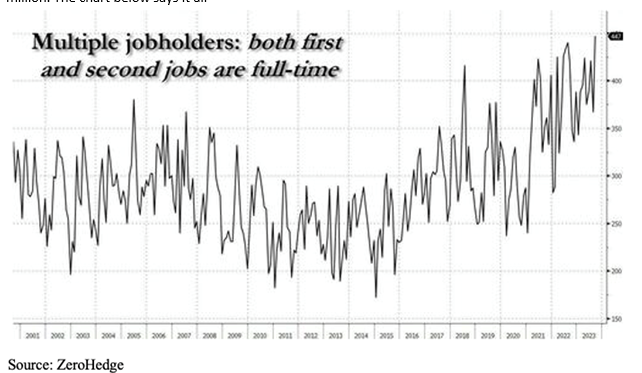
According to Rosenberg Research, over the past three months, the Household Survey has shown a -40K decline in job holders and +665K more unemployed people. To show the stress on household budgets, over those three months, the number of multiple job holders has risen by +243K to a near record 8.4 million. The chart below says it all
In the latest Challenger survey, layoffs were up 8% from a year ago in October, and hiring announcements were down -85%. Retail’s seasonal hiring is the lowest since 2008; that says something about what retailers think of upcoming holiday sales. In addition, the U6 unemployment rate, a more comprehensive view of the employment picture, also rose, but by 0.2 percentage points to 7.2% (this was at a low of 6.5% last December). We also note that the number of companies announcing large layoffs is rising with several new announcements each week.
While the employment picture has moved toward “balance” from where it was in 2022 and early 2023, we expect that it will move passed “balanced” and deteriorate. Remember companies over hired since the pandemic for fear of not having anyone and many of those especially in retails had fewer hours worked. The shift is beginning to swing in the opposite direction. Keep in mind that the nature of the cycle is that it always goes through “neutral” or “balanced,” both when it rises AND when it falls. October may be the first of many such weak employment reports.
Another indicator of job weakness is employment in the head-hunting business. It has contracted, down -115K since February. When the head-hunting business is struggling, it is a sign of a weak job market.
One of the reasons that the U.S. economy has remained in growth mode is the “resilient” consumer. Keep in mind that consumers make up 2/3rds of GDP Unfortunately, that appears to be changing. The “free money” from Uncle Sam kept the consumer buoyant, at least through Q3. Now there is reason to believe that the “free money” has been spent.
Credit card balances are now at record levels (and at interest rates in the mid-20% range). Delinquencies are now rising. Balances are at record levels, $1.1 trillion, up 16% year over year. The chart shows that credit card debt now totals $3,800 per capita, up $1,000 per person since October 2021.
Earnings expectations for the Retail industry are being cut as major retailers reduce guidance. And stock analysts have been cutting their earnings forecasts. Banks have cut back on staff and have restricted lending both to consumers and businesses while upping their loan loss reserves.
Housing affordability is at a 35-year low because of high prices, but equally to blame are mortgage rates, now over 7%. As for inflation, that’s about the only good news; it looks like it is melting.
Most American households pay for day-to-day items (groceries, gasoline) with a credit card. So, as prices have risen, so have card balances. Delinquencies have risen too, now at 5.8% (up 0.7 percentage points in Q3). Auto delinquencies have risen in tandem with credit cards, now at 7.4% of outstanding balances in Q3. And 2.5% are over 90 days past due, keeping the repo man busy!
Nowhere is the inflation bite more evident than in the interest rate on those credit cards. All of them are 20%+ and some approach 30%. For the low- and middle-income families, it has become increasingly hard to keep up. Many have maxed their credit card limits. Unfortunately, the banks have been denying requests for increased limits (and requests for new cards) at near-record or record levels. More cardholders are being charged late fees, are falling behind on minimum payments, and are facing higher costs on a growing debt burden. About 10% of card users were in “persistent debt,” a term used when cardholders pay more in interest and fees each year than what they pay toward the principal.
Now that the “free money” has been spent and there is little room left on the credit card line, there is nothing left to do but cut back. The reality is that even modest cut backs, if widespread, have significant economic consequences, including Recession.
We note that auto sales fell in October (-1.2% from September). They are now down in three of the last four months. And the latest Fed Senior Loan Officer Opinion Survey (SLOOS) indicates that banks have continued to tighten lending standards in Q4, and that includes for autos.
The economy can’t be very good when earnings expectations in seven out of 10 sectors are falling. Health care costs lead the way with a -16%+ reduction in Q4 earnings of course we know that most of that came from the government paying to vaccinations and now many are getting vaccinated any more. In looking at the S&P 500 as a whole, expectations are for a -4% in earnings growth. The equity market is quite sensitive to these earnings expectation changes even if it does not appear to be reacting to this information lately.
In addition, the Johnson Redbook reported a -1.5% fall in same store sales in October and the big box stores like Target (TGT), Walmart (WMT), and Costco (COST) noted in their Q3 reports that customers were both “trading down” and were forgoing discretionary purchases.
Manufacturing is already in Recession. The ISM Manufacturing PMI at 46.7 for October has been in contraction (below 50) for 11 months in a row.
And the ISM Services PMI was 51.8 in October, down from 53.6 in September and disappointed the consensus forecast of 53.0. It, too, appears to be headed for contraction, and soon.
Credit is the lifeblood of an economy, when the banking sector contracts, the economy fades. And banks are contracting. Since the March Regional Bank blow-up, banks have:
- Lost deposits;
- Reduced lending in every loan type, and are denying applications for an increase in credit card lines at the highest rate in history. In addition, they have also tightened mortgage lending standards;
- Have rising delinquencies in consumer, auto, and commercial loan sectors;
- Are all raising their loan loss reserves;
- New consumer loans, auto loans, and credit card loans are at or near historic lows;
- In the Regional Banking space, Commercial Real Estate (CRE) loan issues are rising. 15 of 18 Regional Banks reported increasing charge-offs and those non-performing loans had risen 80% from Q3 ’22.
The Housing Industry continues to slide as mortgage rates approach 8%. Affordability is at its lowest level since the 1980s. DR Horton, a major U.S. builder, reported slowing sales in Q3 and sees very slow sales growth ahead (2.8% in 2024). We think even this is optimistic. Horton is now offering smaller homes at lower prices.
We’ve seen sales collapse in the existing home space (pending sales down -13% year over year), and mortgage applications are now at three-decade lows. With homeownership out of reach for most, one would think that landlords would be able to raise rents. Not so! There has been a glut of new product, and there is weak demand as most of the population that wanted to move during the pandemic have done so by now. According to FNMA, vacancy rates have reached 6.5%; the 15 year average is 5.8%. And the downward pressure on rents looks like it will continue as the record number of apartment units under construction are completed. In addition, regional home demand varies significantly. In the northern states homes are sitting on the market for months especially new construction, developers will be force to drop prices in order to reduce dept load construction loans tend to be based on a floating rate and with winter around the corner an empty home will just add to the cost of maintain that home for future sale.
Wage growth has not turned into the much-feared wage-price spiral the Fed was so worried about. According to Rosenberg Research, the three-month annualized rate of wage growth of +3.2% is more than consistent with a 2% or lower rate of inflation, as productivity showed up as +4.7% in Q3 and +2.2% Y/Y. Quoting Chairman Powell (his November 1 press conference): The wage increases have really come down significantly over the course of the last 18 months to a level where they’re substantially closer to that level that would be consistent with 2% inflation over time.
The Baltic Dry Index is now down -74% from its October 2021 peak. And the world’s biggest container shipper, Moller-Maersk, just announced a -10,000-person layoff! It wasn’t that long ago, when the cost of shipping a container, if they could even be found, was $20,000+.
To cap off the discussion of inflation, the growth of the Money Supply (M2) is now, for the first time in history, negative. For monetarists, that means deflation is just around the corner!
The Fed’s own internal views are that inflation is rapidly falling. The NY Feds inflation gauge is at a 30 month low and on a steep decline, while the San Francisco Fed predicts that inflation will be nil by the end of 2024.
So, this is why economist are talking about rate cuts by the fed in 2024 the underlying economic conditions are not all that positive. Of course, this all depends on the consumer and their behavior a spike in CPI during holidays could change things. As we have mentioned in past article bad behavior generally results in bad outcomes. So, if we get that recession, we think it just might be a painful one. Source Economist Bob Barone PhD
Technical Perspective of the Market
With a shortened week for the markets we will keep this update simple. We are going to look at the equal weight S&P 500, briefly discuss its technical characteristics, and some historical context.
Let’s start with the S&P 500 equal weight index. and share some historical information on the difference between the two measurements
The S&P 500 as we here in the media is a capitalization weighted index; its largest stocks have the greatest impact on its performance, Apple, Microsoft, Nvidia, Amazon, Meta. The index’s largest stocks are all technology-related. In fact, the largest seven technology company stocks make up 30% of the movement in the S&P 500.
The equal weight S&P 500, on the other hand, evenly diversifies its weightings across its 505 components. So, the impact of those large technology-related stocks is more muted in the equal weight index.
The information technology sector, which contains Apple, Microsoft, and Nvidia, is near at a new high. This sector also happens to be the largest sector in the S&P 500 by a considerable margin, accounting for over 28% of the index and has moved the “market index” higher, while the average stock has not really done all that well. In fact, throughout the recent volatile swing in the markets, the equal weight index declined more from its peak than the cap-weighted S&P 500 and has now rallied less. Now, the equal weight index is butting up against some overhead resistance.
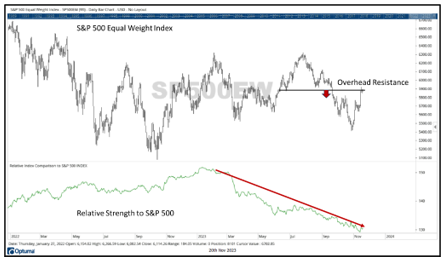
In the chart above, the lower portion of the chart shows the equal weights relative strength to the cap-weighted S&P 500. Relative strength has been declining throughout all of 2023. So this means that the equal weight index is underperforming the cap-weighted S&P 500 because of its more balanced weighting in technology stocks.
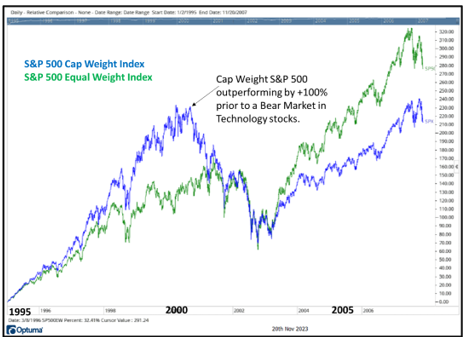
Over the long-run (with data going back to 1990), the equal weight S&P 500 has historically outperformed the cap-weighted S&P 500. Yes, you read that correctly, most of this outperformance has come during bear markets. Right now, the S&P 500 is overweight technology-related stocks. The market index had the same issue heading into the year 2000.
From 1995 to 2000, the cap-weighted S&P 500 outperformed the equal weight index by nearly +100%. Markets then experienced a bear market in the early 2000s. That bear market was fueled by a bubble bursting in the parabolic technology stocks. As a result, the S&P 500 fell substantially. By the end of the bear market cycle, the equal weight index was outperforming the cap weighted index.
The S&P 500 is often referred to as the “market index.” That does necessarily mean that it is an efficient index contrary to EMH theory But because of hype and media influence we use it as the market benchmark. Its strongest performers from the past will become its largest components. Right now, the index favors technology-related stocks, just as it did prior to the bear market in 2000. There is a substantial gap between the performance of the largest technology stocks and the performance of the rest of the market. The market tends to rebalance itself, often in the form of a bear market.
Technology stocks have fueled the market’s recent bounce, but the bounce may be running into some resistance. This is a situation we continue to monitor. The goal here is to maintain stability and consistent volatility, regardless of the market’s fluctuations. Source Brandon Bischoff
The Week Ahead
Thanksgiving week has arrived, with U.S. markets closed on Thursday and shutting down early Friday at 1:00 PM ET. As expected, the economic calendar is lighter than usual, but still contains a few important releases. The FOMC meeting minutes and global flash manufacturing and services PMI surveys should garner the most attention. Rising jobless claims and last week’s inflation data may have removed concerns about any further Fed tightening, but the minutes will still be scrutinized for any division among the committee members. This week will present another opportunity to check the appetite for U.S. debt, with 5-, 7-, and 20-year Treasury auctions on tap.
Other U.S. data includes existing home sales, durable goods orders, and revised consumer sentiment and inflation expectations. Technology and AI bellwether Nvidia, whose stock has risen well over 200% this year, reports Q3 earnings Tuesday after the close. On the international docket, Europe and the UK may be entering a period of stagflation, so Thursday’s flash PMIs for November will provide an update on the health of those economies. In Asia, whether Japan will end negative interest rates depends largely on the inflation outlook, raising the profile of October’s core CPI reading to be released late Thursday. Finally, China may keep their prime loan rates unchanged for now, but with Beijing pledging huge fiscal support for the flailing property sector, additional policy action may be required to boost the struggling equity markets.
This article is provided by Gene Witt of FourStar Wealth Advisors, LLC (“FourStar” or the “Firm”) for general informational purposes only. This information is not considered to be an offer to buy or sell any securities or investments. Investing involves the risk of loss and investors should be prepared to bear potential losses. Investments should only be made after thorough review with your investment advisor, considering all factors including personal goals, needs and risk tolerance. FourStar is a SEC registered investment adviser that maintains a principal place of business in the State of Illinois. The Firm may only transact business in those states in which it is notice filed or qualifies for a corresponding exemption from such requirements. For information about FourStar’s registration status and business operations, please consult the Firm’s Form ADV disclosure documents, the most recent versions of which are available on the SEC’s Investment Adviser Public Disclosure website at www.adviserinfo.sec.gov/
The Optimized Investor
