
Weekly Market Review for January, 27th 2023

The content of this Newsletter is to provide you with Economic insights to assist you in making better decisions with your investments. Unlike many other financial periodicals we will not mention specific companies, unless it is relevant to an overall economic issue. We welcome your questions on economic concerns and will address in our newsletter. just email us at info@optfinancialstrategies.com #FinancialAdvisor,#investmentmanagement #wealthmanagement #financialplanning #retirementplanning #401kplans
Week In Review
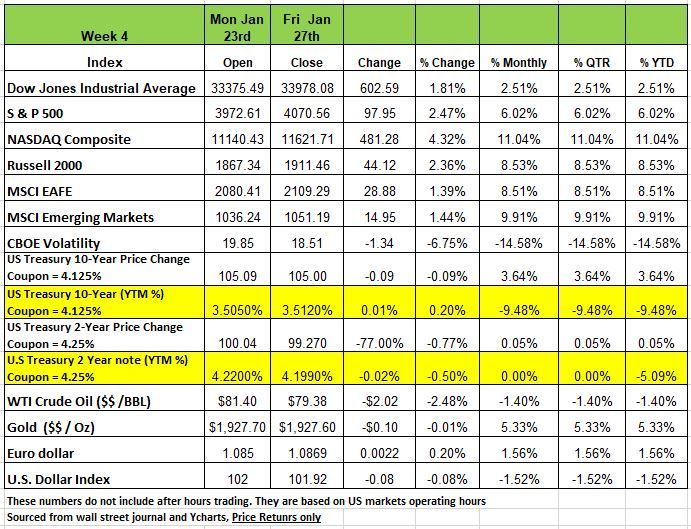
All market index performed well last week with the NASDAQ taking the lead with a +4.32% return followed by The S&P 500 Index returning +2.47% The Russell 2000 +2.36% and the DOW pulling up the rear with + 1.81% increase.
After declining -5.76% in December of 2022, equities have shown resilience in January with the NASDAQ index climbing +11.04% in January following by the Russell +8.53 and the S&P +6.11% YTD in 2023. The
Federal Reserve’s dual mandate of maximum sustainable employment and price stability has put them on an aggressive track to combat the high inflation we have experienced over the last 18 months from all the bad decisions made during the pandemic.
There has been increased concerns in the equity markets that the Fed might slow the economy too fast or too much through their rate hikes and push the economy into recession. We think we are already in one but it’s the media that controls that information.
While the U.S. economy has shown its own resiliency as 4th quarter 2022 GDP numbers released last week were higher than expected and U.S. initial jobless claims were reported at 186K last week, lower than the consensus estimate of 205K and previous week’s claims of 190K. Declining inflation readings since June and other recent economic indicators have also increased hopes that the FOMC may begin to slow their rate hikes and achieve a soft landing, which has given the recent boost to equities.
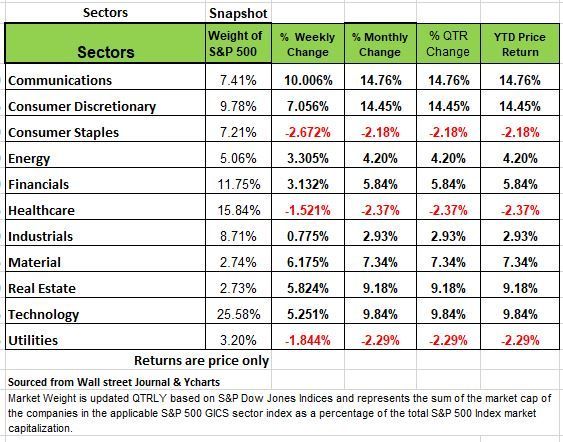
Communication services +10% was the best performing sector in the S&P 500 Index last week, followed by Consumer discretionary +7% Material +6.17 Real Estate 5.82% and Information Technology +5.25% the 3 down sectors were all defensive Consumer Staples -2.672% Utilities -1.84% & Healthcare -1.52%
U.S. Treasury bond yields were mixed across the yield curve last week as investors digested economic data during the Federal Reserve’s blackout period, which limits Federal Reserve officials speaking engagements leading up to the rate decision meeting on February 2nd.
In response, analysts and pundits weighed in on the size of the Federal Reserve’s next interest rate hike. According to the CME Fed Watch Tool, by the end of last week the probability of 25 basis point increase reached 99.2%. Treasury yields rose on Thursday as domestic GDP data came in better than expected.
Real GDP for the fourth quarter increased at a 2.9% annual rate, which was higher than expected 2.6% increase. Though the headline data looks favorable, strong inventories and personal consumption were the largest contributors, which will inevitably slow with the rest of the economy in 2023. The week ended with the Federal Reserve’s preferred measurement of inflation, the PCE Deflator, pulling back to 5.0% in December from 5.5% in November, indicating inflation is slowing.
Inflation and Rent
To best understand one of the reasons behind the surge in inflation over the last 18 months we should look at one component of our economy the cost of Shelter. This will also give you a gauge on where inflation is heading.
CPI numbers released earlier this month from December was a comforting surprise and maybe be one of the reasons the markets have responded so positively so far for the month of January. The number came in several basis points lower than the consensus expected showing a contraction in the YOY number and a modest upward move in the core prices, leading many economists to believe that inflation has peaked, and the worst is behind us.
However, while broader inflationary pressures have eased, there remains one persistently sticky inflationary component which is increasingly accounting for the lion’s share of CPI growth: shelter.
Housing is a crucial component of the economy and is often used as a barometer for economic conditions. Shelter is the largest single component of CPI, accounting for 32.7% of the bucket. Of this, it is comprised of the smaller “Rent of primary residence” component and the much larger “Owners’ equivalent rent”, or OER.
OER measures how much money a property owner would have to pay in rent to be equivalent to their cost of ownership. It is calculated by asking property owners what they would be willing to pay to rent their homes which is just an accurate indication of price movement like, as compared for instance, the price of a dozen eggs. As a result, the strength of the rental market feeds through to both rent and OER numbers.
So, to get an idea on the movement of inflation, we think that it is helpful to have an understanding on where housing may be heading, So, we’ll look at how the rental market is faring.

According to Zillow, rents surged in 202, (see chart) for many reasons but primarily because landlords were unable to evict non rent paying tenants throughout the pandemic, even though their tenants received government stimulus money, but still had to pay their overhead expenses. In addition, there was a run to get out of urban areas and buy homes at above market price as many feared getting sick in bigger cities and lastly landlords recognized that government stimulus programs had left many Americans flush with cash and it was time for payback. These rent prices now appear to be coming off the boil. In some of the country’s largest cities, like New York and Houston, rents have been falling for the last several months; and at a national level, price appreciation appears to have plateaued since interest rates have increased dramatically. The two most recent readings showing modest 0.1% monthly increases.
All economic downturns are the result of bad decisions and the U.S. has made more than its share of bad decisions during the pandemic. Now that the pandemic-era stimulus has largely dried up, Americans have started dipping into their savings to spend – including on rent – it seems possible that national rents will start to fall in the coming months. Especially as more multi units housing becomes available in different regions of the country. Once the supply means the demand their will be more equilibrium.
For investors looking for signs that inflation will continue to cool, and that interest rates will stabilize, this outlook for the rental market should be celebrated and hope that it encourages the Fed to change its course. Source https://am.jpmorgan.com/us/en/asset-management/adv/
Market Perspective
For those of you that are believers of the Efficient Market Theory (Indexing) let me share a little insight to your investing style. As we have addressed in the past indexing doesn’t work in the long run. While some people may find benefits if they retire during a Bull market the need to sell assets to meet your annual income needs is not the wisest strategy, especially when you need to liquidated in a bear market like 2022. You’re selling your assets at a discount because you need the cash.
The S&P 500 needs a rally of 33% to recover last year’s losses in real (inflation-adjusted) terms, the Nasdaq requires an intimidating 61%, and if we look at ARKK, Cathie Wood’s ETF, as a proxy for aggressive growth stocks, you will need to triple! That is 300% to break even.
Some of the very largest cap and most reliable growth names – the likes of Amazon, Alphabet, Meta, the wonder companies of the past decade – must rise 70% to 150% to regain their 2021 peaks. These are also the names of the stocks that we most heavily weighted in the index and ETF funds.
So, we ask, do you know what your cost basis is in these investments’ vehicles? Was your portfolio on autopilot? Not thinking what price you were buying your investments on a regular basis by sending the company a check every two weeks?.
The damage done last year to broadly diversified stock/bond portfolios is the worst in nearly a century. It is the only time that we could see that both Bond and equities took such beating. Typically there is a negative correlation between these two assets.
At the beginning of last year, investment professionals publicized that 2022 would be another double digit up year. we did not think so and neither did Jeremy Grantham who predicted that total losses across the three major asset classes of stocks, bonds, and real estate could reach $35 trillion in the U.S. alone, including $17 trillion in stocks and $6 trillion in bonds. So far, with real estate still making up its mind, losses in U.S. stocks have been over $10 trillion and in bonds over $5 trillion, in addition to an unexpectedly large loss of $2 trillion in cryptocurrency. Which we have penned in the past is a foolish investment.
Many Investment professionals and economist that got it wrong last year are blaming these serious losses due to the combination of the war over Ukraine, described as unexpected, and the surge in inflation, also described as unexpected in its severity and persistence. We think that they were just not paying attention to things and were too focused on gathering more assets and speaking on TV.
The key here is of course the word “unexpected.” The irony for us is that we expected a broad market decline without any such unexpected help. Our reasoning was simple. Explosions of investor confidence with persistently rising stock prices, such as existed during the pandemic are rare and have only occurred in the U.S. three times in the equity market – 1929, 1972, and 2000 (and even then, 1972 was marginal) – We also had it occur once in the housing market, in 2006. Need we remind you of the results of those bubbles?
When you’re investing heavily in growth stocks you’re speculating and while there is intelligent speculation, once you made your profit you should get out and not be greedy. The most speculative growth stocks that led the market on the way up over the last 10 years got crushed, and a large chunk of the total losses across markets that we expected to see a year ago have already begun. When we look at the conditions that led to the extraordinary speculative excitement, we felt a significant correct was certain. The excuse from the pundits that got it wrong used “negative surprises” of last year, with the war in Ukraine & the global inflation spike, seemed a bit unnecessary to cause a significant downturn.
We are not bragging about being so good or having a crystal ball we just pay attention to the markets and look for the obvious. That is what we get paid to do, and not to put your portfolio on autopilot.
In order to reach bubble proportions, history has taught us that you need to pay attention to a few conditions 1) a long economic upswings, record or at least very attractive profit margins, 2) a strong employment situation, and 3) foolish policies from the Fed and the U.S. government that encourage more speculation. This leads to a nearly perfect environment for investors to become overconfident, thinking that this time is different.
From these economic, financial, and psychological peaks we felt that there was a high probability that the markets would head in one direction and that the economy would deteriorate, just like it did in the past and that is exactly what happened
Now here is where we think things get more complicated. Valuations are still nowhere near their long-term averages, historically, they have usually overcorrected to below trend as fundamentals deteriorated. As famed investor Bob Farrell has stated in his 10 rules for investing “markets tend to return to the mean over time” Such an outcome still remains highly likely, but given the complexities of an ever-changing world, we have less certainty about the timing and extent of the next leg down.
A variety of other factors may come into play including subsiding inflation, the ongoing strength of the labor market, and the reopening of the Chinese economy lead to the possibility of a pause or delay in the bear market, a head fake so to speak. The month of January looked promising but we are not convinced by the positive movement. Volatility does not reverse at the snap of one’s fingers.
We need to stay focused on corporate fundamentals and how significantly they weaken. This will give us better picture on direction over the next several months.
For long term fundamental investors, be careful, one of the biggest concerns are the long-run issues of declining population, shortages of raw materials, and damage from climate change are beginning to bite hard into growth forecast. The resource and geopolitical shocks of last year will only exacerbate those issues. And over the next few years, given the change in the interest rate environment, the possibility of a downturn in global property markets poses significant risks to the economy. Source Jeremy Grantham
A Technical Perspective
For those new readers to our newsletter technical analysis is an investment strategy /trading discipline that relies on identifying opportunities by analyzing statistical trends gathered from trading activity, such as price movement and volume. While no one can identify the bottom and peak price of a security, technical analysis tries to identify opportunities close to it.
Markets tend to be counterintuitive especially in a bear environment and just adding to the confusion the masses. Last year was the definition of a bear market. For 2023, it began in a bear market. Now the question is will it end the year as a bear.?
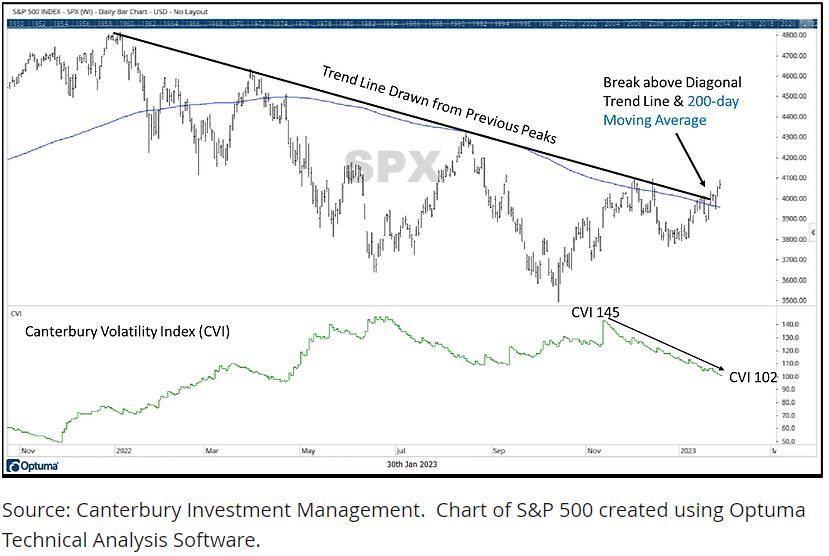
For the month of January, things are certainly starting to look “up” for the broad markets. The S&P 500 has continued its short-term rally that began in late December. Volatility (as defined by the Volatility Index, “VI”) has fallen significantly off its highs. But more important the S&P index has also broken above its 200-day moving average, and above a contentious trend line drawn from the index’s previous peaks. (see chart Below) Additionally, it has put in a recent higher low point. The market is starting to look more "transitional" than "bearish". So we wonder will it be able to hold this position? Or, is this the calm before the bear market swipes its paw again?
2022 experienced a global bear market. Now, the S&P 500 is seeing some positive developments, that is being felt globally.
However, what is surprising in the risk adjusted rankings, the has shifted towards the international markets. Remember technical analysis is focused on trends not fundamentals, it’s a trading tool for entry and exit points and while movement is positive we are paying more attention to the flow of money and volume. We are not convinced its time to jump head first without checking to what is under the surface.
The Week Ahead
This coming week looks to be the busiest week of the year so far, will it set a tone for the remainder of the year? Three central bank decisions are due to be released with all eyes on the U.S. Fed on Wednesday , the monthly U.S. labor reports, and a slew of big-name earnings announcements will also be released this week.
The FOMC seems to agree on slowing the pace of rate hikes, but do not want to risk inflation becoming entrenched and may need to reinforce such expectations with Wednesday’s statement.
On Thursday morning, the European Central Bank is likely to raise rates by 50bps, while the Bank of England may be divided on how much to hike as it grapples with sky-high inflation and a slowing economy.
Wednesday’s ADP and JOLTS reports precede Friday’s nonfarm payrolls, where the pace of wage growth will be closely scrutinized. Other domestic events of note include consumer confidence, ISM PMIs, and industrial productivity.
Earnings season continues with tech giants Apple, Amazon, Meta, and AMD, among others. Internationally, OPEC+ meets on Wednesday with much to discuss around China’s reopening and Russian sanctions, but the next policy-setting gathering isn’t until June. Eurozone CPI and China PMIs round out the overseas calendar.
This article is provided by Gene Witt of FourStar Wealth Advisors, LLC (“FourStar” or the “Firm”) for general informational purposes only. This information is not considered to be an offer to buy or sell any securities or investments. Investing involves the risk of loss and investors should be prepared to bear potential losses. Investments should only be made after thorough review with your investment advisor, considering all factors including personal goals, needs and risk tolerance. FourStar is a SEC registered investment adviser that maintains a principal place of business in the State of Illinois. The Firm may only transact business in those states in which it is notice filed or qualifies for a corresponding exemption from such requirements. For information about FourStar’s registration status and business operations, please consult the Firm’s Form ADV disclosure documents, the most recent versions of which are available on the SEC’s Investment Adviser Public Disclosure website at www.adviserinfo.sec.gov/
The Optimized Investor
