
Weekly Market Review for January, 2023

The content of this Newsletter is to provide you with Economic insights to assist you in making better decisions with your investments. Unlike many other financial periodicals we will not mention specific companies, unless it is relevant to an overall economic issue. We welcome your questions on economic concerns and will address in our newsletter. just email us at info@optfinancialstrategies.com #FinancialAdvisor,#investmentmanagement #wealthmanagement #financialplanning #retirementplanning #401kplans
Week In Review
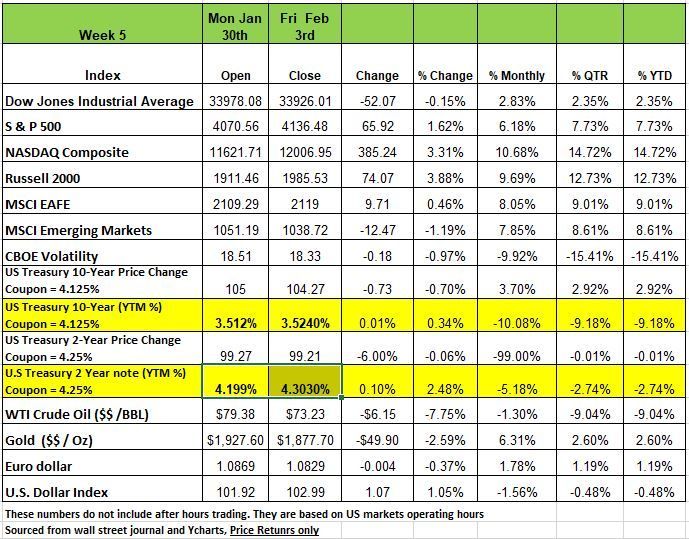
Three of the 4 major indices pull off gains last week with the DOW being the only one to produce a negative return with -.15% The Russell 2000 took the lead with a +3.88% return followed by the NASDAQ with +3.31% and the S&P 500 rising +1.6% this is the fourth weekly gain in five. The month of January wrapped up on Tuesday with the index rising over 6% year to date while the tech-heavy Nasdaq 100 gained nearly 11%.
January has been described as a rally of previous "losers and laggards" as several of the most broken business models saw their stocks rally over 100% including Peloton, Carvana. Much of the movement last week came off of companies like META which rose +22.9% in just two days and is heavily weighted in the S&P and NASDAQ. The best performing stock of the week was Align Technologies +27.5% which reported stronger growth in 2022 and was bullish for 2023
Most of last week’s attention was place on the Fed and Powell’s remarks after the months FMOC meeting. The Fed raise interest rates another 25 basis point which is what the markets expected but most investors and the media took the tone of Powell’s comments as dovish and while he did mention more rates increases in the future the markets seem to be calling his bluff. Currently swap traders are pricing in another 1-2 hikes before expecting the Fed to begin cutting rates in the second half of the year. In addition to the Fed meeting the other big news came off the Jobs report with January showing an increase of 517 new jobs in the month of January. We will address this later in this market recap.
Powell reportedly dodged a question about the tight labor market and strong financial conditions which caused investors to believe that the Fed may act more dovish in 2023 than previously thought.
As of the Friday close, half of the S&P 500 companies have reported 4Q22 earnings with Utilities and Consumer Discretionary faring the best so far. Overall the current earnings season has been the weakest since 2020 although companies have still beaten sales and earnings estimates on average. Investors will continue to be watchful for any areas of weakening demand as they digest quarterly results from over one hundred more of the S&P 500 constituents in the week to come.
The Fed interest rate hike of 0.25% brings the Fed’s target for its benchmark rate to a range of 4.5% to 4.75%. The Fed also signaled it would continue to raise rates to return inflation to its 2% target, despite acknowledging a recent slowdown in the inflation rate, or disinflation. So far, the Fed’s efforts to rein in inflation by raising interest rates have not appeared to weakened labor market. Our concern with these numbers is that they are using adjustments and the numbers make no sense.
U.S. Treasury yields spiked on Friday as traders repriced year-end fed funds rate expectations based on the new jobs number and unemployment data. While many are predicting a soft landing, we are not all that confident however with this political environment and reckless spending who knows how the markets will react.
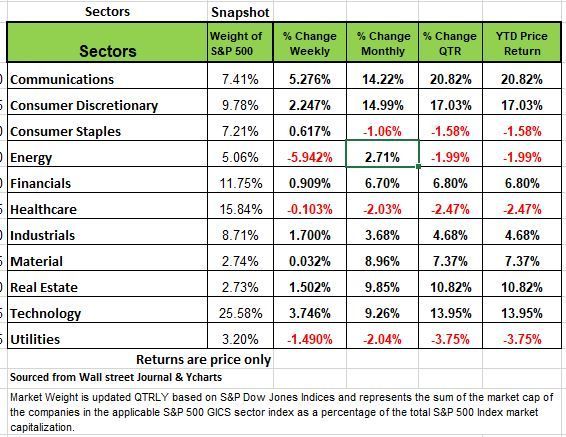
By sector, communication services had the largest percentage increase this week, up 5.3%, followed by a 3.7% climb in technology and a 2.2% rise in consumer discretionary. Other gainers included industrials +1.7, real estate +1.5, and financials +.90.
Three sectors were in the red. Energy fell -5.9%, followed by a -1.5% decline in utilities and a -0.1% slip in healthcare.
New Job Numbers
Something just doesn’t make sense. Last weeks jobs data was a whopping +517K in new jobs for the month of January. This just seems to be a bit out of whack with the rest of the economy and labor market data. The financial market reacted as they typically do in fear that the number would mean the Fed would raise interest rates further in inflation did not drop faster. On Friday both the 2 and 10 yr treasury spiked significantly on this news
Several various reliable economic sources with deep research capabilities, revealed that most or all of the +517K job gains wasn’t due to new job creation, but to benchmark revisions, seasonal adjustments, and population controls, all keywords for what we can only describe as statistical manipulation.
So how much manipulation was there? Morgan Stanley concluded from their research that without the population adjustments, the Household Survey (which was larger +894K), only rose +84K, while Rosenberg Research concluded the real Payroll number was only +44K. This is concerning as the government’s economic agencies are supposed to be independent and unbiased.
Last Wednesday ADP released its private payroll numbers it was only +106K. Historically there has been a 98% correlation between the ADP and Payroll employment reports. So, this divergence is quite unusual, and it appears that one of these reports is misleading.
ADP’s numbers have been below BLS’s for 7 months in a row (by -642K over that time period) and by more than -1.2 million over the past year. Given the state of the economy, with little to sluggish growth throughout 2022, it appears that ADP’s numbers are more accurate. One advantage of the ADP report is that it sorts its data by firm size giving us better insights.
Most of America is employed by small business that are much more sensitive to changes in the economy and react much more quickly than large businesses, this sector shed -75,000 jobs in January. And, over the last four months, -260,000. So these number are dropping and the governments numbers are rising
What do you think is behind the difference
Here are some other inconsistencies we found by looking at the data between the payroll data and other well recognized economic observations:
Most recent Payroll Report: Retail +30K --- retail sales have fallen in November, December, and likely January – why would they be adding jobs, especially during the slow season after the holidays?
Leisure and Hospitality +128K January and Feb are the slowest months in the industry after coming off holidays season and spending
Construction added +25K --- Housing starts, building permits, and construction expenditures are down double digits. New jobs in that industry just doesn’t make sense.
Transportation/Warehousing +23K --- Amazon laying off -18K and Fed Ex laying off management staff. Again, the Payroll Report is at odds with reality.
Manufacturing +19K. Every Regional Fed survey showed weakening manufacturing. And the Industrial Production Index itself has been negative for three months in a row.
You can see these numbers for yourself at https://www.bls.gov/news.release/pdf/empsit.pdf
Other incoming Data that just conflicts with the jobs report
Challenger, Gray and Christmas, a well-known outplacement service are the “experts” in job cuts. They recently indicated that January job cut announcements rose +136% M/M from December and were up +440% Y/Y. Layoffs have occurred in every economic sector except energy (and tech led the way). Hiring announcements fell -36.6% M/M in January, and were down in three of the last four months, and were off -58.7% Y/Y. These are big numbers. Yet the BLS (Government is stating we had huge job growth. What country are they monitoring?
In the housing sector, the all-important spend on single-family construction was off -2.3% M/M in December, has been down eight months in a row, and is down -14.7% Y/Y. We expect January to continue the downtrend. Yet this sector add +25K jobs.
Non-Residential Construction also showed up negative in December (-0.5% M/M) led by a -2.3% falloff in expenditures in the Manufacturing Sector. In fact, Industrial Production fell in October, November and December, and various surveys indicate that it fell again in January.
One of those surveys is the Chicago PMI (Purchasing Managers Index). it has been below 50 (the demarcation line between expansion and contraction) for the last five months. https://www.ismworld.org/supply-management-news-and-reports/news-publications/inside-supply-management-magazine/blog/2023/2022-02/rob-roundup-january-2023-manufacturing-pmi/
Then there is the consumer whose spending comprises 70% of GDP, is the ultimate key to the economy. In past articles we have penned the rise in credit card balances (trying to maintain living standards). We note that those card balances are up nearly 19% Y/Y, and as noted in our last article, credit card companies are setting aside larger amounts of reserves for expected rising delinquencies. Auto delinquencies for consumers that are more than 60 days behind on their payments are up 26.7% more than in December https://www.cnbc.com/2023/02/04/auto-loan-delinquencies-rise-what-to-do-if-you-struggle-with-payments.html
Needless to say, credit scores will be dropping significantly meaning that consumers will have more difficulty in getting loans later with bruised credit ratings. Meaning that recovery will be slower with less access to money for larger purchases like cars and homes.
We are not sure exactly why the government agencies are acting so irresponsibly in their economic releases. We do not want to speculate that the data manipulation is being driven by other authorities Unfortunately, this gives the Fed justification to continue its rate raising regime. Even though we know they are a lot smarter that we are and can figure this out. We are confident that they will raise another 25 bps in March and maybe again in the next session, but that depends on how the pros interpret the health of our economy. This group of professionals are slow to reach to the obvious and hence we have concerns over delayed responses when things just get too bad.
One last point historically, M2 (cash + demand deposits + time deposits + money market funds), has never had negative Y/Y growth, until now. M2 and the CPI are closely entwined. Expect inflation to continue to dissolve. As seen time and again over economic history, a negative M2 growth rate also implies Recession. Source Economist Bob Barone PhD
A Technical Perspective
For those new readers to our newsletter technical analysis is an investment strategy /trading discipline that relies on identifying opportunities by analyzing statistical trends gathered from trading activity, such as price movement and volume. While no one can identify the bottom and peak price of a security, technical analysis tries to identify opportunities close to it.
Alan Greenspan once said Markets do very weird things because it reacts to how people behave, and sometimes people are a little screwy.
There is certainly some truth to the quote above. At the end of the day, it is not profits and earnings that drive stock prices, and it is not the state of the economy. Markets are driven by the law of supply and demand, which is a function of how people interact in the marketplace. As a result, markets will have periods when they appear to act rational, periods when they are flat-out erratic, and other periods where they just appear to be a little bit “screwy.”
Thursday was a “screwy” day in the markets. Meta Platforms (Facebook) saw shares jump more than +20%, after reporting earnings Wednesday evening that failed to meet already low analyst forecasts. Other technology stocks also saw their share prices rise substantially, many of which were set to report earnings after hours on Thursday. Earnings expectations for these companies also had low bars. The ending result of Thursday’s trading session saw the Nasdaq up +3.60%, while the rest of the market was actually flat-and-down; the Dow Jones Industrial Average was down -0.11%. This was the largest single day gap between the Nasdaq and Dow since March of 2021.
In the face of bad news and low expectations, the worst performing stocks from 2022 have been some of the best performers in 2023 The Memes are back. These companies are reporting lower earnings, laying off employees, or pausing hiring. Yet, in many cases, their stock prices have risen to begin the year. Company results should influence stock prices, you want performance and stability, but in this environment its supply and demand, and the actions of investors no matter how irrational that are driving prices.
If the stock market leads the economy, stocks should go up prior to hearing any news of economic recovery. In 2021 we started to see large technology stocks experience higher volatility, prior to negative company reports. At one point in 2022, Meta stock was down -70%. It is no surprise that earnings would be low or even less than expected. Perhaps the market discounted future (now current) negative news into its price last year.
So, the question is if stocks are improving, all while the news remains negative, is the market out the woods, or is this a “bear trap?” There are a cases that can be for both sides.
Positives:
Right now, many equity indexes have moved out of a “Bear” Market State and into a “Transitional” one. Volatility has declined, and markets have moved above key moving averages. Looking at our universe of equity securities, there are starting to be many more “buy” signals. At the same time, the leadership is beginning to shift, and the Nasdaq is outperforming the Dow Jones and S&P 500, indicating that investors may be willing to accept more perceived “risk.”
Negatives:
Technology stocks have risen quickly and sharply to begin the year. The sharp, fast bounce in a single month looks more parabolic than it does sustainable. The Dow Jones index, which has a higher concentration of industrials and traditionally “defensive” stocks, is only slightly positive for the year and has looked much more rational. It would be expected for the Nasdaq and Technology stocks to have some sort of “backing and filling” to relieve some overbought conditions. The large up days, like the one seen last Thursday (when the Dow Jones was flat), would not be expected to occur in a rational market.
As a final note, something that has come up in the news lately is whether the market right now is “wrong.” Many would look at the state of the economy and think that the market is mispriced and should go lower. Others may expect things to get much better and that the market is “undervalued.”
You can be in one of two group FOMO fear of missing out of JOMO Joy of missing out. Be careful about following the herd and looking for the quick buck. A good Strategy is not short term. Know and understand what your needs are and be smart.
There is an old phase “Markets are never wrong” the market “is what it is.” Market pricing is based on human reactions which are often driven by emotion and beliefs about the future. As we started this update, those emotions and beliefs can sometimes be rational, other times be irrational, and sometimes just be screwy.
Don’t get caught up in the day-to-day noise or try to make a prediction of where the markets will go. Markets are the perfect example of the wisdom and the madness of crowds. Because of this, they are unpredictable and counterintuitive.
You cannot control the markets, but you can control how you construct your portfolio, based on how “screwy” the market is today.
Source Brandon Bischoff
The Week Ahead
Investors could probably use a breather after the past two weeks’ data dump, this week’s calendar will be lighter schedule following the jobs reports.
In the U.S., speeches by FOMC members will resume in earnest, including Chair Powell on Tuesday at the Economic Club of Washington DC. U.S. Treasury 10- and 30-year auctions should draw some interest midweek, while the first look at February’s consumer sentiment arrives on Friday.
Earnings season is winding down but reports from Disney and Uber will merit some attention. Overseas, Australia is expected to raise rates by 25bps later tonight, as the RBA walks the fine line between a fragile housing market and rising inflation.
The UK will release the first estimate of Q4 GDP on Friday, which could reveal the second straight quarter of contraction and a technical recession. The European docket includes retail sales, Germany’s delayed CPI figures along with industrial production and factory orders, and economic forecasts from EU members.
Lastly, China’s consumer inflation is expected to accelerate after several months of pandemic-related declines.
This article is provided by Gene Witt of FourStar Wealth Advisors, LLC (“FourStar” or the “Firm”) for general informational purposes only. This information is not considered to be an offer to buy or sell any securities or investments. Investing involves the risk of loss and investors should be prepared to bear potential losses. Investments should only be made after thorough review with your investment advisor, considering all factors including personal goals, needs and risk tolerance. FourStar is a SEC registered investment adviser that maintains a principal place of business in the State of Illinois. The Firm may only transact business in those states in which it is notice filed or qualifies for a corresponding exemption from such requirements. For information about FourStar’s registration status and business operations, please consult the Firm’s Form ADV disclosure documents, the most recent versions of which are available on the SEC’s Investment Adviser Public Disclosure website at www.adviserinfo.sec.gov/
The Optimized Investor
