
Weak Economic Data, Acquisitions on the rise, COBRA Subsidy
& Other Economic News
for the Week Ending
September 3rd 2021

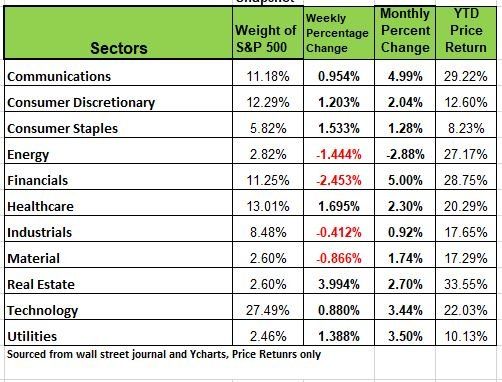
Last week marked the end of the month and what we traditionally think of as the end of summer. 10 of this the 11 sectors were up for the month with Energy being the only sector in the red with a -2.88% return. Volatility was minimal despite shutdowns from Hurricane Ida, and OPEC’s decision to keep its production increases in place. However, for the year Energy is still at a 26.6% price return. All of the major indices were in positive territory for the month with NASDAQ and the Russel 2000 at 4% or more price return. For the week the markets were relatively flat with the NASDAQ being the only indices with a return above 1%. This was a surprise considering that the jobs report was a huge disappointment along with rising COVID cases due to the Delta Variant. We expected the market to react a little more to this news but perhaps there is a little more time before reality hits. There does seem to be a shift to more defensive sectors like Consumer Staples, Utilities and Healthcare. These sectors were the big winners for the week ending Sept 3 where 4 of the 11 sectors were in the red.
Canada’s economy unexpectedly contracted by 1.1% in Q2 as pandemic restrictions weighed, while European inflation pressures lingered, with August Eurozone CPI registering a 10 year high of +3% YoY
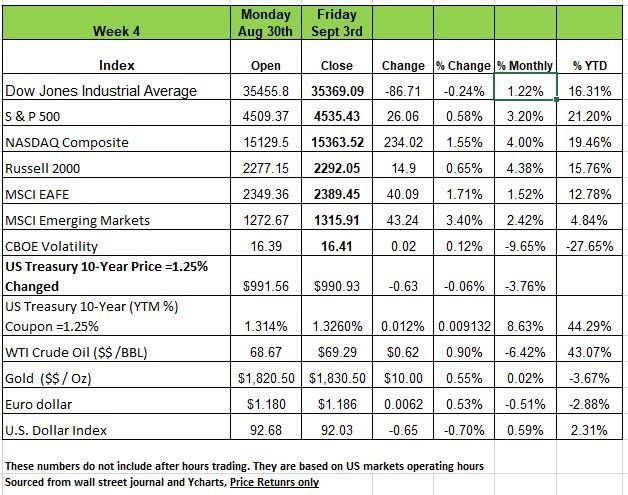
The yield curve steepened last week with shorter-dated treasury yields falling and longer-dated treasury yields finishing higher for the week. Treasury yields were mixed throughout the week as investors waited intently for Friday’s jobs report. Nonfarm payrolls increased 235,000 vs 733 expectation in August. Professional and business services had the largest increase of 73,000, while restaurants & bars declined 42,000 due to headwinds from the Delta variant and college-age workers returning to school. Investors did find bright spot in the jobs report. The unemployment rate in August fell to 5.2%, the lowest level since the beginning of the pandemic. But these number may show a different story once benefits expire.
The dollar (DXY) continued its slide after the economy added just 235,000 jobs in August, far below expectations of 720,000, while the ADP report showed that private payrolls also increased much less than forecasted. The labor numbers are casting doubt on the Fed’s next move regarding on tapering.
Manufacturing jobs rose, but services hiring ground to a halt as the market braces for several jobless aid programs to expire this week. On the positive side, the unemployment rate fell to 5.2%, the underemployment (U6) rate dropped sharply to 8.9% from 9.6%, and jobless claims hit a new pandemic low of 340,000.
Other U.S. data still reflects that we have an expanding economy (but remember the baseline) however some cracks are beginning to show in the system. Consumer confidence fell again in August, the lowest level since February, while Chicago PMI deteriorated more than expected to 66.8 from 73.4. Factory orders and the ISM Manufacturing PMI did pick up in August, but the services PMI fell from its July all-time high reading, consistent with the jobs report. U.S. home prices rose 18.6% YoY in June, the largest annual gain in history, and are now 41% above than the 2006 peak. One note on this is that unlike 2006 most of these purchases are with cash or lower financing, unlike 2006 where everything was over leveraged.
Looking ahead, we expect a modest slowdown in jobs growth due in part to rising COVID-19 cases. The forecast calls for 850,000 new positions created and is based in part on the trends in weekly unemployment claims, which have been bumpy in recent weeks. The latest reading was for claims of 353,000, up 4,000 from the prior week. As well, we note that the U.S. vaccination count is only slowing rising (52% of the U.S. population is fully vaccinated, up 300 basis points in the past month), allowing new variants to spread and jeopardizing the recent trend of service workers being called back to their jobs.
Labor Markets
The story of the week ending 9-3-21 was the "big miss” in Nonfarm Payrolls, most of the incoming data continue to be much softer than the markets or financial media let on, and they continue to ignore the implications. The Payroll Survey: Friday’s Nonfarm Payrolls at +235K disappointed the consensus view (+733K), another big miss on the part of the business forecasters. Once again as we have stated in past newsletters predicting human behavior is difficult
We have also stated in the past that the pandemic and its nuances (Delta-variant) aren’t seasonally adjustable. From a strictly statistical point of view, the pandemic data hasn’t been around long enough to display seasonality and using seasonal factors from pre-pandemic data makes no sense because today’s data is profoundly influenced by the pandemic (i.e., re-opening, mask mandates, supply-chain issues, government supplemental payments, school re-opening issues …). Nevertheless, the August +312K NSA number appears close enough to the +235K SA one – so what’s the issue?
The people with jobs are the ones that get paid. Over the last two months, BLS has told us that 1.288 million (SA) jobs were created (1.053 million in July (revised) and 235K in August). The NSA numbers (these are the actual job counts) for both months combined was 278K (312K for August and -34K for July). 278K new payrolls is a far cry from 1.288 million. Perhaps this is why the August business surveys show employment softness! Noteworthy: the NSA data shows -64K in the retail sector, -74K in leisure/hospitality, -50K in accommodation (hotels) and -52K in restaurants. This data strongly implies that the Delta-variant has had a dramatic economic impact. We think this impact will continue at least for another few months.
Economic signals
In addition, if we look at U.S. vehicle sales beginning in 2015, sales were fairly steady until the pandemic, then climb out to just above normal as many city dwellers moved to the suburbs and needed cars, but now there is renewed falloff. Sales in August were -11% lower than in July, as they fell to a 13.5 million annual rate. They were nearly 19 million in April. This could be due to a number of factors, supply chain issues especially with Chip shortages. The governments subsidy / helicopter money may have pulled demand forward, and there is just no inventory meaning no production hence no work.
The impacts from the Delta variant are continuing to impact the economy. Restaurant reservations are falling, hotels are experiencing cancellations and a lower number of room nights, and a significant number of major corporations have delayed a return to the office. The latest employment data show job losses in the retail, hospitality, and restaurant sectors, however like we have mentioned in the past we are unsure just how much fraud is involved in these numbers.
Here are just a few numbers we are looking at that is showing weakening economy:
Mortgage Applications: -2.4% W/W (last week of August) and -11.6% YTD. (Could be inventory issue)
All five Fed Manufacturing Surveys declined in August (e.g., Dallas 9.0 August vs 27.3 July (consensus: 23.0; way off the mark).
TSA screenings: August 31 - the fewest since May 11,
Pending Home Sales: -1.8% M/M (July) (consensus: +0.4%). This is on top of -2.0% in June. Sales have been down in three of the last four months and in five of the last seven. On a Y/Y basis, sales were -9.5% lower, and July was -12.4% below December.
The Atlanta Fed GDP Nowcast for Q3 stands at +5.1%; it was +6.4% a month ago. The NY Fed’s GDP model is down to +3.8% for Q3. It was +4.2% in July.
Johnson Redbook’s latest report showed a -0.6% drop in same store sales of major retailers.
Source Bob Barone PhD Economist
Acquisition Deals
Corporations world-wide embarked on an unprecedented deal spree this year, emerging from the depths of the pandemic looking to bulk up and address the vulnerabilities it exposed. Simultaneously, buyout firms and blank-check companies have been deploying hundreds of billions of dollars at a feverish pace.
In the first eight months of 2021, companies have announced mergers and acquisitions worth more than $1.8 trillion in the U.S. and more than $3.6 trillion globally, according to data provider Dealogic. Both figures are the highest at this point in a year since at least 1995, when Dealogic started keeping records. Deals are on track to surpass their record set in 2015.
The merger wave is minting money for Wall Street. At big banks and boutique advisory firms alike, deal-advisory revenue reached new heights in the first half of the year. Goldman Sachs, the top deal making shop on Wall Street, brought in more than $1 billion in fees in each of the three last quarters. It surpassed that level only once in the decade before the pandemic.
COBRA Subsidy
The COBRA subsidy period under the American Rescue Plan Act (“ARPA”) is nearing its end (September 30, 2021). Under ARPA, an assistance eligible individual (“AEI”), which is a COBRA qualified beneficiary who becomes eligible for COBRA due to a reduction in hours or involuntary termination of employment, may be eligible for a COBRA subsidy equal to the entire COBRA premium for the period from April 1, 2021 through September 30, 2021.
Remember, employers and plan administrators are required to provide subsidy termination notices to AEIs before their COBRA subsidy ends.
Employers and plan administrators must send the subsidy termination notices to AEIs no more than 45 days and no less than 15 days before the date that the COBRA subsidy will end for the individual. For many individuals, this means that these notices must be sent between August 16 and September 15 to reflect the end of the COBRA subsidy period on September 30, 2021.
The subsidy termination notices must include the following information:
· A statement that the COBRA subsidy will end soon and “prominent identification” of the date that it will end; and
· A statement that the individual may be eligible for coverage without a COBRA subsidy through COBRA or another group health plan.
· The notice is not required if the COBRA subsidy is terminated due to eligibility for another group health plan or Medicare.
We have provided a link to the model notice that the DOL released:
Post Pandemic Investment Landscape
When a crisis happens, people often look to history to guide them through the situation. But there’s no real analog for the COVID-19 pandemic, which brought the global economies to a standstill and prompted unprecedented sums of government support.
You can look back to the Spanish flu, or the investment booms after World Wars I and II, but all those comparisons fall short because of the uniqueness of this crisis,”
For one the world operates completely differently that it did back then, technology has entered the lives of just about everyone and helped maintain some form of survival.
But what should investors do to help mitigate the effects of the pandemic on their portfolios—and potentially seize the opportunities afforded by the recovery.
First realize that we’ve never seen the stock market fall and recover as steeply and quickly as it did in the spring of 2020. Stocks are pushing fresh records for much of this year, understanding why is helpful. The emergence of the Index and ETF Fund has given investors an easy way to gain exposure to a basket of stocks and well as 401K plans so the frequent deposits into the market on a regular basis has allowed for such a quick recovery
So how should investors position themselves for what comes next? We’re entering an environment in which we could see one of two extreme outcomes. One could be a return to spending large dollars due to people being couped up for so long, But the other could be a short-term pop as people take early retirement and draw down on their investment accounts. Once the outflows start to exceed the inflows in the market and if inflation has more than just a transitory position, then markets could fizzle and hinder growth. As contradictory as it may sound, investors can prepare for both scenarios by taking time to understand exactly what is in their investments and move to a more defensive position.
Energy Sector
We continue our series on the 11 sectors that make up the U.S. econpomy. This week we take a look at the Energy sector. This sectors includes oil and gas drilling, equipment, exploration, refining, marketing, storage and transportation; and coal mining and production.
In early July, some financial institutions downgraded the rating on the sector to “market perform” from “outperform” as it hasn’t performed as anticipated—even with higher oil prices—and new risks have emerged
Despite a deal being struck, the recent breakdown in talks between OPEC+ members and subsequent call for lower oil prices by the Biden administration are raising uncertainty—both in terms of the cohesion of the OPEC+ cartel and the increased politization of the energy market.
The rise in oil to a price well above the average breakeven level—even after the recent volatility— may threaten energy companies’ resolve to be more disciplined with expenses and investment. Meanwhile, the U.S. dollar has rallied—which is generally inconsistent with higher oil prices—and investor sentiment appears to have become too optimistic.
Together, these developments have diminished the risk/return tradeoff, in our view. However, there are still many positive attributes to the sector that could reassert themselves if some of the risks are resolved.
Since the low point of the COVID-19 crisis in 2020, the Energy sector has lagged the sharp rise in the price of oil and is well below the historical average of that relationship—though the clean energy movement may have loosened the relationship somewhat. This is still likely an intermediate-term tailwind for the sector, as it could provide a buffer for energy stocks if the price of oil were to weaken. Additionally, even with the sharp rise in oil, they haven't ramped up capital expenditures as they have done historically. Therefore, if there is a significant decline in oil, they are less exposed to stranded assets (investment that becomes obsolete).
Valuations in the Energy sector—though above the historical average—are attractive relative to the other sectors. Despite the strong gains in energy stocks since the market lows in 2020, they have not kept up with rapidly rising earnings expectations. This is not surprising, as investors have remained wary of the boom/bust sector, while equity analysts found optimism amid the combination of rising oil prices boosting revenues and restrained expense growth.
Finally, oil inventories have declined. With the reopening of the global economy, the recovery in demand for oil has outstripped supply by cautious producers—OPEC and U.S. producers alike—driving inventories lower. A continued decline in inventories against the backdrop of higher demand is inherently supportive for oil and potentially energy companies.
There are still many positive attributes of the sector that could spur renewed outperformance. But until the risks are alleviated and the positives reassert themselves, we think that market-weight exposure to the energy sector is appropriate at this time.
Positives for the sector:
Oil prices are being supported by improving demand, curtailed supply and a drawdown in inventories.
Large diversified energy companies have strong balance sheets and have become more disciplined with expense and investment management—though the high price of oil could erode this self-control.
The ongoing recovery of the global economy and expansion phase of the U.S. economic cycle bodes well for the continued recovery in oil demand.
Valuations are attractive relative to other sectors.
Negatives for the sector:
Less cohesiveness within OPEC is causing higher volatility in oil prices.
Strong U.S. dollar is inconsistent with recent strength in oil prices.
Increasingly onerous regulatory environment—though implementation is likely to be measured;
U.S. oil and gas majors have been slow to shift towards clean energy—but potential subsidies might encourage greater adoption of renewables.
Shareholder activism has risen.
Risks to the sector:
Easing in Iranian sanctions and increased U.S. production could increase oil supply and weigh on prices.
OPEC discord could lead to a price war.
Numerous risks to global growth stemming from COVID or geopolitical flareups;
A significant rise in market volatility and rise in the U.S. dollar;
Trend toward clean energy to reduce oil demand in the long term.
The Week Ahead
A shortened week and the economic calendar will be more focused on events abroad as the U.S. docket is light. The most anticipated announcement will come from the ECB on Thursday, where despite hot inflation data, the committee is expected to wait several more months before deciding on tapering pandemic-related asset purchases, which are due to end in March 2022.
Additional monetary policy updates will come from Australia tonight and Canada on Wednesday. In the U.S. the JOLTS Job Openings report drops on Wednesday, and producer prices are expected to ease in Friday’s PPI report. Monthly 10-year note and 30-year bond auctions may liven up a quiet interest rate environment, along with several speeches from FOMC members. In Asia, China will deliver trade balance and inflation numbers, while Japan’s final Q2 GDP reading is released late on Tuesday. The Eurozone will present economic sentiment reports on Tuesday along with revised Q2 GDP, and the UK’s monthly GDP update comes in Friday. The week also closes with Canada’s employment account.
This article is provided by Gene Witt of FourStar Wealth Advisors, LLC (“FourStar” or the “Firm”) for general informational purposes only. This information is not considered to be an offer to buy or sell any securities or investments. Investing involves the risk of loss and investors should be prepared to bear potential losses. Investments should only be made after thorough review with your investment advisor, considering all factors including personal goals, needs and risk tolerance. FourStar is a SEC registered investment adviser that maintains a principal place of business in the State of Illinois. The Firm may only transact business in those states in which it is notice filed or qualifies for a corresponding exemption from such requirements. For information about FourStar’s registration status and business operations, please consult the Firm’s Form ADV disclosure documents, the most recent versions of which are available on the SEC’s Investment Adviser Public Disclosure website at www.adviserinfo.sec.gov/
The Optimized Investor