
The Recession is Here & more on the Economic Climate
for the Week Ending July 1st 2022

The content of this Newsletter is to provide you with Economic insights to assist you in making better decisions with your investments. Unlike many other financial periodicals we will not mention specific companies, unless it is relevant to an overall economic issue. We welcome your questions on economic concerns and will address in our newsletter. just email us at info@optfinancialstrategies.com #FinancialAdvisor,#investmentmanagement #wealthmanagement #financialplanning #retirementplanning #401kplans
If you take a moment to look at the chart below you will notice a lot of red. The first half of the year has been the worst for the investment community since 1970. All of the major indices have been in the red all year with the exception of a few rallies in May and June. The NASDAQ and Russell 2000 and down by more than 20% for the year and the S&P has been entering and exiting the 20% mark for the last quarter. The DOW is the only index not to exceed that mark yet. This isn’t any wonder. The incoming data has shown significant deterioration in the economy and major data revisions have all been to the downside. The markets have always been indicators of what is to come.
Consumer confidence fell sharply in June as personal incomes failed to keep up with rising prices, with inflation adjusted spending falling 0.4% MoM.
The U.S. trade deficit narrowed in May on record exports, but inventories continued to rise on supply chain uncertainties. Overseas, Eurozone inflation reached a record 8.6% YoY as the ECB prepares for rate hikes in July and September. German CPI declined in June, but experts attributed it as temporary due to government subsidies
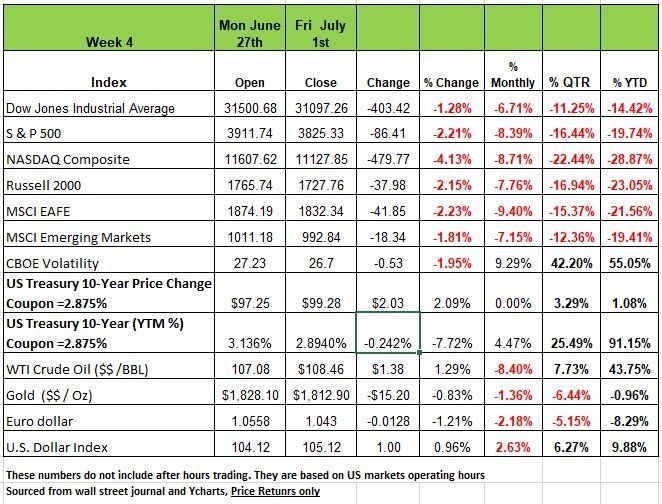
Treasury yields tumbled last week ahead of Independence Day. This was based on recession fears as several economic reports indicated a slowdown in the US economy. Keep in mind when Bonds yields drop the price of the bond has gone up, When Yields go up the prices drop. For those holding Bond Funds this year you may have seen the value drop this was mostly due to prices dropping. So, for those less familiar with the mechanics of the bond market, this is why the 10-year US Treasury yield fell to 2.88% from its recent peak of 3.47% on June 14, highlighting the volatility in Treasury markets. The ISM Manufacturing Index fell below expectations to 53.0 in June, a level still indicating expansion in manufacturing but a slowdown to the lowest level since June 2020. However, the ISM New Orders Index showed a contraction in new orders in June due to higher prices, longer lead times, and high inventory levels. Consumer spending did grow 0.2% in May, but it was the lowest level of the year and a slowdown from April’s 0.6% month-over-month increase. Adjusted for inflation, however, consumer spending fell 0.4% in May, meaning consumers spent more to get less.
Economic Climate
The Recession is Here!!
Yesterday we celebrated 246 years of independence and our country is now more than two years into an economic recovery from the two-month COVID Lockdown. While the economy improved dramatically from the economic bottom in April 2020, we are now feeling the pain from the decisions made to address the pandemic situation.
Economically we are still suffering from three major policy mistakes.
First, running an overly loose monetary policy for way too long. This is having low interest rates and too high level of money supply.
Second, handing out too many government checks, which allowed American consumers to borrow from future production and spend more in the past two years than they would have if no pandemic had ever occurred.
Third, shutting down many parts of the economy through government mandates at multiple levels. It seemed like politics drove many of these decisions and not logic as you see below here are the consequences.
The most recent revision to Q1 GDP data put the first quarter deeper into negative territory at -1.6% (the initial estimate was -1.3% and the first revision was -1.5%). What’s worse, is that consumption, was revised down to +1.8% for Q1 from +3.1%. Keep in mind that this is what keeps economic growth buoyant. What this translates to is a much weaker transition into Q2. Given what we are seeing from the high frequency data, it looks very much to us that Q2 GDP growth will also be negative.
The NY Fed’s model shows an 80% probability of a Recession, and the Fed’s Atlanta Reserve Bank’s GDP Now model puts Q2 GDP growth at -1%. If this number is close, that would be two quarters in a row of negative GDP growth, the media’s definition of a recession. While the National Bureau of Economic Research (NBER) is the final arbiter of a recession’s start and end dates, the markets’ rule of thumb has always been two consecutive quarters of negative GDP. Also there has never been a period with 2 quarters of negative GDP where a recession did not occur. For those that are readers of our newsletter we have been predicting this all year, so it appears that we are on the cusp of being validated.
Until mid-June, the financial markets were all about “Inflation,” So much of the everyday media still is focused on it. But, in mid-June, financial markets began to worry more about Recession than about Inflation. For example, the peak in the 10-Yr Treasury Note yield was at 3.48% on June 13. The coupon was 2.875%, so this means the market was forcing prices down. On Friday (July 1) it closed at 2.89%, prices increasing which indicates that markets no longer think the Fed will enact all of its rate hikes implied by its “forward guidance.”
Here are a few reasons why we think the bond markets have behaved this way:
The economic outlook for business has rapidly deteriorated. The Philadelphia Fed forecast for new orders shows the lowest outlook since 2002. https://www.philadelphiafed.org/surveys-and-data/regional-economic-analysis/mbos-2022-06
The University of Michigan’s overall Consumer Sentiment Index, http://www.sca.isr.umich.edu/
which we have addressed many times over the past few months, appears to be a very good leading indicator of future consumer spending. It is now at the lowest level in its history 50.0 (going back to the 1940s).
There appears to be good reason why this index is so low. We haven’t seen this level of inflation for about four decades. Thus, the majority of consumers have never had to deal with it. In addition, it also appears that the real level of inflation is much higher than the CPI implies. The fact is, even with rising wages, consumers have fallen way behind. Real average weekly earnings (i.e., adjusted for “official” inflation) have fallen -3.5% over the past year. Whenever that has happened in the past, a recession has ensued and we don’t think this time is any different.
In addition, consumers have tried to maintain their living standards by borrowing on their credit cards. Not a good sign. Think of it this way: if a consumer normally fills the gas tank using a credit card, but now it costs $100 instead of $60, the amount of credit usage just went up $40. Keep in mind that Credit cards are used for food and most other consumption. Sooner or later limits are reached with consumers unable to pay off monthly purchases and carrying debt forward. https://www.federalreserve.gov/releases/g19/current/
With this in mind It isn’t surprising, that Americans will cut back on their consumption. Gasoline volume sold (number of gallons), the first week of June was down -8.2% Y/Y (and down 14 weeks in a row).
A recent survey (GoBankingRates.com) of a sample of 2,357 between April 11 and June 21 showed 38% of Americans intend to cut back on dining out, 16% will travel less, 13% will spend less on groceries, and 10% will spend less on gasoline. Only 18% said they haven’t cut back. This will hurt the restaurant industry, hotel and travel industries. https://www.gobankingrates.com/saving-money/cutting-back-how-americans-are-dealing-with-inflation/
Housing
Housing, including new homes and the furniture, appliances, carpets etc. that go into them, are a very important piece of GDP. New home sales, existing home sales, housing starts, and permits to build are all falling. Mortgage applications for purchase are down double digits, and refis have tanked -75% Y/Y. Housing starts are at their lowest level in a year, and homebuilder sentiment is at a two year low as mortgage rates have skyrocketed – the S&P Homebuilder Equity Index is down nearly twice that of the S&P 500 as a whole. https://www.spglobal.com/spdji/en/indices/equity/sp-homebuilders-select-industry-index/#overview
Something Positive – Inflation Will Be Falling
We know that we have painted a very bleak economic picture and this may worry many of our readers but our job is to be truthful in our interpretation of the economy. While many pundits are trying to put a positive spin on the data you need to keep something in mind that most are working for a investment fund and need to keep a positive outlook in order to attract new money.
With that said there is some good news inflation will soon begin to fall, both because it always was “transient” (just taking longer) and because the Fed has hit the brakes hard on it monetary policy.
We are seeing some cracks developing in home prices (finally!). A June 18 headline from the Advisers Perspectives publication read: Builders Are Slashing Prices to Sell https://www.advisorperspectives.com/articles/2022/06/18/builders-are-slashing-prices-to-sell-homes-in-fast-cooling-us-markets
Homes in Fast-Cooling U.S. Markets. The article went on to say that both Compass and Redfin (real estate brokerages) are slashing jobs.
In Phoenix, 22% of new listings had price cuts between May 9 and June 5.
In Dallas, there is 10.7 months of homes under construction; that’s twice normal.
Commodity prices, which rose rapidly due to supply chain issues caused by the pandemic, have rolled over. The prices as of June 23:
Copper: -24%
Oil: - 15%
Natural Gas: -33%
Aluminum: - 36%
Nickel: -50%
Lumber: -57%
And the Baltic Dry Index (average prices paid for transporting dry bulk goods): -58%.
As for the supply chain:
Freight rates from China to the U.S. are down -34% YTD and -50% Y/Y;
The number of ships waiting at the LA and Long Beach ports in CA was 22 in mid-June. It was 109 a year earlier.
In-bound containers at the 10 largest U.S. ports were down -25% Y/Y (May data).
In looking at the five Regional Fed Manufacturing Surveys, we are seeing faster supplier deliveries and rapidly falling order backlogs, both of which indicate a significant easing of supply chain bottlenecks which have played a major role in today’s inflation issues.
Rental rate increases have been slowing and the national vacancy rate is now rising as a surplus of newly built multi-family units have begun to come to market. We look for rents to stabilize, if not fall, over the next few months. Keep in mind home rent is 30% of the weight in the calculation of CPI so this again will bring the numbers down.
The bottom line here is that our economy is not in great shape and much of it is a result of poor decisions and politics. There is no free lunch and there is always a cost for poor behavior. In this case consumers behaved like they hit the lottery and consumed beyond their needs during the pandemic, so it is no surprise we are paying for it now. Next week the FOMC meeting decide on interest rate hike we think it may be another 75-basis point hike but will stop at that point. There is no meeting in August and September meeting will be at the end of the month so the Fed will have plenty of economic data and suspect will keep rates flat at that point. Source Economist Bob Barone Ph’D
The Sacrifice Ratio
There is a very esoteric term in economics known as the sacrifice ratio. It is a link between inflation and unemployment. Basically, in order for inflation to decrease unemployment needs to increase. The mathematical formula is Sacrifice ratio = cost of production lost / Percentage change of inflation. Historically or at least over the last 50 years a one percentage point drop in inflation would require an unemployment rate increase of 6% in one year. The lower the unemployment rate per year the longer out it would take for the same result. This was what happened back in the 1970’s when inflation was more systemic and at much higher levels. Recently the media has posted some articles regarding the potential outcome. However, the flaw in the media’s comparison is that we live in a completely different environment today. Back in the 1970 more physical labor was required for economic output. In addition, more goods were produced in the U.S. Today a larger percentage of our GDP is in finance and technology rather than manufacturing like in the 1970’s.
As we discussed in previous post, inflation is basically the result of consumer behavior. Demand exceeding supply is the simplest way to describe what happened during the pandemic. With so much cash in their pockets, (funded by the U.S. Government) the American Consumer took to shopping. While the savings rate increased dramatically during the pandemic this was mostly attributed to a small percentage of the population. The rest spent.
According to Larry Summers, former U.S. Secretary of the Treasury stated back in February of 2021 that the governments stimulus package was far too large and that it would lead to high inflation. The question on everyone’s mind now is how long this level of inflation will last and what the cost of containing it will be.
While many economists at the Fed see it differently, the Fed is setting its expectations of unemployment reaching 4.1%. Considering the Fed track record, we are not all that confident in their models. However, the issue that remains for us and many is if a new paradigm will evolve just like we had over the last 12 years with ultra-low interest rates and low inflation.
While we do agree that unemployment will increase and think it will move higher than 5% mostly because of debt and the cost of refinancing that debt. Too many companies out there are operating with little to no profit and that the money needed to keep these businesses afloat will be harder to attain. We believe that inflation will start tapering significantly over the next several months. We are more concerned about the depth & length of the recession more than the inflation and the Feds ability to manage it. Based on its track record & poor decisions we are no too confident. Source https://www.marketwatch.com/story/heres-why-larry-summers-wants-10-million-people-to-lose-their-job-11655800397?cx_testId=3&cx_testVariant=cx_2&cx_artPos=6&mod=WTRN#cxrecs_s
The Week Ahead
U.S. markets were closed yesterday for the Independence Day holiday, leaving a shortened week busy with releases. Fed chair Powell said last week that the post-pandemic global economy “has been driven by very different forces” and that “we now understand better how little we understand” regarding inflation, a sobering admission.
After U.S. GDP contracted in Q1, the Atlanta Fed now forecasts real growth diminishing further in Q2 by -1.0%, which would fit the technical definition of recession. This week’s attention shifts to the U.S. employment picture and to what extent inflation is influencing labor trends. Friday’s non-farm payrolls are expected to show slower gains compared to prior months as weekly jobless claims have been rising. Wednesday’s JOLTS report is likely to confirm that employers are still struggling to fill vacancies despite rising wages. Minutes from the June FOMC meeting could provide insight into the committee’s aggressive pivot. Factory orders, consumer credit, and ISM Services PMI round out the U.S. calendar. Internationally, the RBA’s probable 50bps rate hike may lift the Aussie dollar from 2-year lows. In Europe, a light docket is highlighted by EU economic forecasts, ECB meeting minutes, and German industrial production. China’s inflation figures wrap up the week
This article is provided by Gene Witt of FourStar Wealth Advisors, LLC (“FourStar” or the “Firm”) for general informational purposes only. This information is not considered to be an offer to buy or sell any securities or investments. Investing involves the risk of loss and investors should be prepared to bear potential losses. Investments should only be made after thorough review with your investment advisor, considering all factors including personal goals, needs and risk tolerance. FourStar is a SEC registered investment adviser that maintains a principal place of business in the State of Illinois. The Firm may only transact business in those states in which it is notice filed or qualifies for a corresponding exemption from such requirements. For information about FourStar’s registration status and business operations, please consult the Firm’s Form ADV disclosure documents, the most recent versions of which are available on the SEC’s Investment Adviser Public Disclosure website at www.adviserinfo.sec.gov/
The Optimized Investor
