
The Law of Unintended Consequences & more Economic News
from the Week Ending May 6th 2022

The content of this Newsletter is to provide you with Economic insights to assist you in making better decisions with your investments. Unlike many other financial periodicals we will not mention specific companies, unless it is relevant to an overall economic issue. We welcome your questions on economic concerns and will address in our newsletter. just email us at info@optfinancialstrategies.com #FinancialAdvisor,#investmentmanagement #wealthmanagement #financialplanning #retirementplanning #401kplans
The markets acted a bit irrational last week, nothing new for 2022, the price returns for all 4 of the major indices were down between .21% (S&P) and 1.54% (NASDAQ) the swings on Wednesday and Thursday are what concern us the most. The Dow went from 33128.79 at close on Tuesday to 34061.06 at close on Wednesday (+932.27) to 32997.97 at close on Thursday (-1063.09). The S&P was similar going from 4175.48 at close on Tuesday to 4300.17 at close on Wednesday (+124.69) to 4143.87 on Thursday (-156.3) we call these outlier days in this case the S&P rose +2.99% and then dropped 24hrs later by 3.56%. This level of volatility is a sign that the markets are in turmoil and is concerned about the economic health of the country.
Last week's moves came as the markets began the month searching for good news following a tough April as all of the indices were down ranging between -4.91% (Dow) to 13.26% (NASDAQ). After Wednesday press conference the markets seemed to be encouraged by Fed Chair Powell comments but Thursday proved to be anything but hopeful as markets gave back Weds gains and took a few more points with it.
While upcoming rate increases may be smaller than previously feared, investors are still uneasy about rates rising throughout the rest of the year. Based on the economic data we are seeing we do not think that will happen as we believe the economy is already stalling, a consequence of poor fiscal and monetary policy.
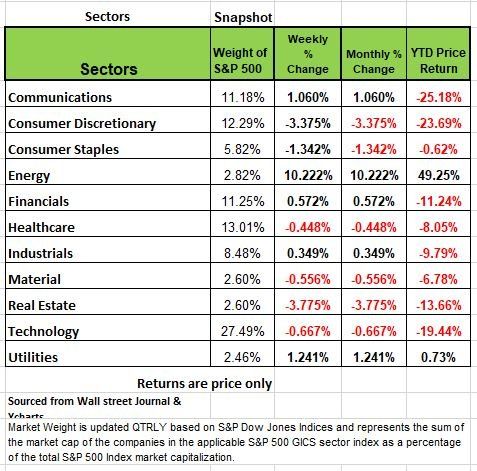
By sector, real estate had the largest percentage drop -3.8%, followed by consumer discretionary -3.4% and a -1.3% slip in consumer staples. Other decliners included technology, materials and health care, down by less than 1% each.
The energy sector had the largest percentage increase of the week as it jumped +10%, but the other sectors in the black were up by a much smaller amount: Utilities climbed +1.2%, communication services rose 1.06%,
The energy sector's advance came as futures in crude oil and natural gas climbed amid a proposal by the European Union to phase out imports of Russian crude over the next six months.
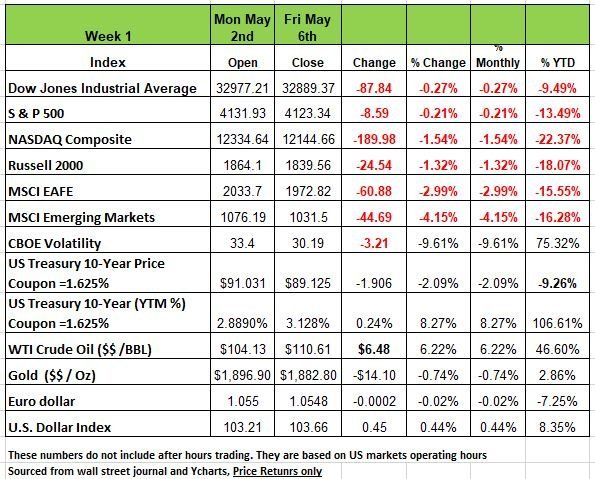
Yields on Long-term Treasury bonds rose significantly over the course of the week as the Federal Reserve increased interest rates 50 basis points and investors worried about stagflation. Keep in mind when yields rise prices are falling. On Monday, interest rates rose moderately, and the 10-year yield briefly exceeded 3.0% for the first time since 2018. The yield curve steepened on Wednesday as short-term yields dropped significantly, and Federal Reserve Chairman Jerome Powell said that the Fed is not actively considering a 75 basis point rate increase at the next meeting. He also said that the Fed will not begin reducing its nearly $9 Trillion balance sheet until June and that more 50 basis point rate hikes are possible at upcoming meetings. Treasury yields then rose significantly, especially amongst longer-term maturities, on Thursday and the 10-year yield closed above 3.0% as nonfarm productivity fell at an annual rate of -7.5%, the lowest level since 1947, and equities sold off.
Investors continued to worry about inflation, which is growing at the fastest pace in nearly 40 years, and lower growth outlooks leading to stagflation. On Friday, long-term yields continued to rise significantly, with the 10-year yield closing above 3.1%, while the yield curve steepened with short-term yields falling. Oil continued its upward trend as the price per barrel rose 5% over the course of the week
The law of unintended consequences
When the pandemic hit back in March of 2020 the Federal Government shut the country down, schools, stores, and even food processing facilities were closed. Then the government realized we needed to keep essential businesses open, so we broaden the scope of business that could operate. The Government sent a massive amount of money to help people that were laid off. What was supposed to be a short two-week closure turned into something much more. The U.S. Government continued to provide essential income to many Americans in many forms, including PPP loans, Unemployment assistance, and PUA (Pandemic Unemployment Assistance) for 1099 workers. We flooded the economy with money and many people not only took advantage of the situation but much committed outright fraud. This is to the tune of billions of dollars that have not yet been fully calculated. But it is estimated that perhaps the number is around 40%. That is astonishing. https://www.nbcnews.com/politics/justice-department/biggest-fraud-generation-looting-covid-relief-program-known-ppp-n1279664
But there is a consequence of all this free money and irresponsible consumer behavior (lines out the door of luxury goods stores like Gucci, Louis Vuitton, etc). consumers not paying rent and putting all that money back into the economy (just look at the consumer discretionary sector in 2021 (+23.66%), drove demand over the top creating a supply shortage, which basically created inflation.
Now the Fed wants to tighten credit conditions and try not to trigger a seizure in credit markets. It may be behind the curve on inflation (we’ll get a better picture this month and next) but political pressure is causing the Fed to move aggressively; in a more compressed timeline which would achieve that goal. The Fed is left walking a tightrope of raising rates and reversing course on the balance sheet while trying to avoid a meltdown.
Chair Powell has said the landing could be “soft-ish” instead of “soft.” The two are not the same. “Soft-ish” includes an increase in the unemployment rate, which is essentially a recession pending on how much of an uptick there is, even if growth does not continue to slip into negative territory. But unemployed people rarely spend enough to keep an economy in + GDP mode (The pandemic was an exception)
The consequences and urgency to deal with inflation were even more apparent with earnings announcements last week. Some of the largest tech companies are feeling the pinch of higher costs and supply chain disruptions. (China) The consumer has pivoted from spending on goods to services so this has taken a toll on online retailers.
So what may sound good on paper may not translate so well in reality. There is no road map for what we have and are experiencing. We live in an interesting time. Our society has changed in the last few decades and so has our behavior toward money. We believe that the economy has some serious weaknesses and the next two months will give us a clearer picture as more new data comes to light. Source Diane Swonk Ph'D Economist
Employment – Weaker than the Narrative
Last week’s April Payroll Survey number (+428K) was characterized by the media as “strong.” However, upon further analysis, the most charitable description should be, in our view, “mixed.” In fact, “worrisome” would be our best characterization. Here’s why we think so:
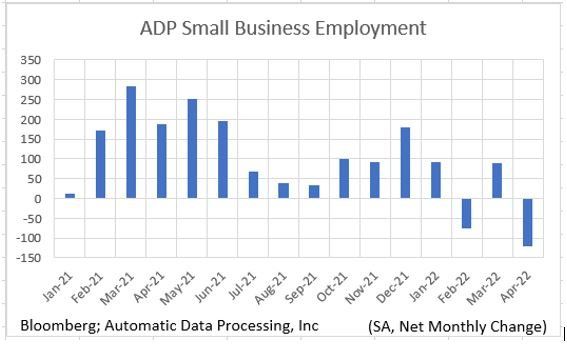
The headline payroll number comes from a monthly survey of large and mid-sized businesses. But because it does not survey small businesses, BLS “adds” jobs that it attributes to that segment. We refer to this as the “Birth-Death” model. https://www.bls.gov/web/empsit/cesbd.htm
So, for April, +160K jobs were added through the “magic” of this “adjustment.” This means that the net new jobs that were actually counted in the survey were +268K, a number far lower than we believe is “Strong” and we believe would have disappointed markets, since it would have been interpreted as a significant slowing from the prior month and below the +400K Wall Street consensus. The chart below is from ADP’s employment report released on Wednesday (May 4). Note the large fall in small business employment in April. Remember ADP is America’s largest payroll service company, so this data is highly credible. If this more realistic -120K were used in place of the +160K (“Birth-Death”), the net for the Payroll Survey would have been +148K, not +428K! and dialogue of a recession would have been leading the headlines.
The BLS also does a Household Survey which resulted a negative number. Net employment actually contracted by -353K in April. This is far from “strong.” Worse, -651K full-time jobs in this survey vanished. While the Household Survey is somewhat more volatile than is the Payroll Survey, it tends to lead at cyclical turning points. It did so in February ’01 and in December ’07. That’s because small businesses are the heart of America’s economy, most Americans are employed by small businesses so this segment reacts to economic conditions much faster than large businesses.
A survey conducted by the National Federation of Independent Businesses (NFIB) suggested that small businesses are paring back their hiring plans. In addition, job postings on Indeed.com are falling. These tend to be a leading employment indicator.
The Household Survey is the one on which the unemployment rates are based. The headline unemployment rate (U3) held steady at 3.6%, slightly disappointing the consensus view that it would fall to 3.5%. The Labor Force Participation Rate (LFPR) (the percentage of the working-age population with a job or actively looking for one) fell from 62.4% to 62.2%. As a result, the labor force declined by -363K. A Strong labor market does not see such a decline.
In addition, 665K people who had jobs in March but lost them in April, they simply exited the labor force. This phenomenon is a characteristic of weakening, not strengthening, employment trends. Had these folks not exited the labor market and had they begun to look for another job (i.e., had the LFPR had held its March level), the U3 unemployment rate would have risen to 3.8%. a move in the wrong direction.
Another broader unemployment measure (U6) which includes those working part-time, but wanting full-time, rose to 7.0% from 6.9%.
Lastly Economist David Rosenberg made an interesting observation “…employment at the employment services sector declined 10.5K…What do you think it means for the job market outlook when the headhunters start chopping their own heads?”
Our belief is that we are just beginning to see the tip of the iceberg regarding employment. As unemployment continues to rise as we expect it to, we will see more weakness in the economy over the next few months. Source Bob Barone Ph’D Economist
Changing headlines?
Many fund companies are changing their performance forecast for 2022. Many of the institutional fund companies that solicit business from financial advisors are finally changing their overly optimistic forecast for 2022. As we have penned in the past it’s important to know what you’re investing in and why. This industry is comprised of two types of advisors, those that know little about the markets but are great sales men and those that do understand them. How you choose an advisor is one of the most important decisions you will make, but unfortunately by the time you figure this out you may have lost a lot of money.
Many people have portfolios made up of funds, Index, Mutual and ETF’s. The job of the wholesaler is to solicit advisors to have them direct as much business to their funds as possible. Many advisors will use models developed by their Broker dealer/RIA to make managing assets easier. Why because they need to spend more time selling themselves to gather more clients and cannot spend the time to manage assets. So, your portfolio may be on autopilot.
Many of these fund companies put out market forecast to help advisor hit on a few economic data points to help advisors get more assets. These forecasts are generally positioned to attract investors with optimistic predictions at the beginning of the year. However, lately these updates headlines read “Reducing Our Stock Market Forecasts”. With the markets down significantly 4 months into the year many institutions are switching gears in order to save face and position themselves for a more trusting outlook in 2023. For those readers of our newsletter, we began the year with a pessimistic outlook, simply because the last two years our economy had been artificially held up by the Government. The bad decisions in both fiscal and monetary policy have caught up with us. We moved many of our clients to cash earlier in the year to protected assets and minimizing exposure.
If you can stomach this volatility, then you have little to worry about however if you are retired, have a or more conservative risk tolerance level you might want to rethink your portfolio especially when we officially enter a recession.
Can you see the obvious?
Sometimes it is difficult to notice the obvious especially when you are smack in the middle of something distracted by short vision. For months we have been very bearish on the market and concerned about the economy. We believe the recent Fed and market actions will push the economy into a recession in a more compressed time frame than one would expect from past tightening cycles. This is because the markets have, in a matter of just over a month, fully implemented the Fed’s “terminal” rate, a target rate of 2% which would take several more 50 basis point (0.5 pct. point) rate hikes.
In previous tightening cycles, the Fed never issued “forward guidance,” so markets never pushed rates much higher than where the Fed rate sat. As a result, because markets have fully implemented the Fed’s 18-month plan, in this tightening cycle, we think that a recession will appear earlier than in past tightening cycles. We feel confident forecast as the incoming data continues to confirm this view.

Here are some other pieces of information, from Q1, the 2.7% gain in consumer spending was supported by a drawdown in consumer savings. The savings rate is now lower than it was pre-pandemic, so that cushion for spending has now been depleted. Furthermore, 80% of Q1’s growth occurred in January, so the handoff to Q2 was quite weak. Yes the Russia /Ukraine conflict began mid-February but the pattern began before then
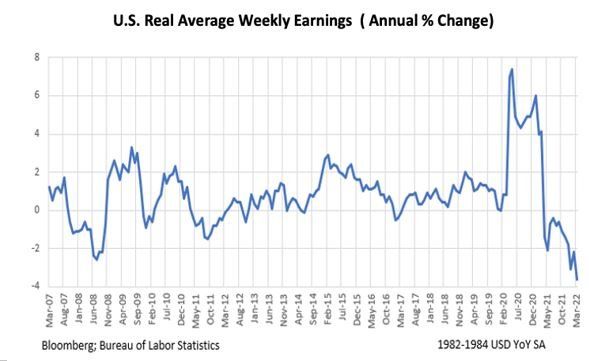
In addition, despite rising wages, average real weekly earnings continue to contract (see chart below) and is weaker than it was in the Great Recession (2008). With savings depleted, prices rising faster than wages, and interest rates up dramatically, rising levels of consumption don’t appear to be a good bet.
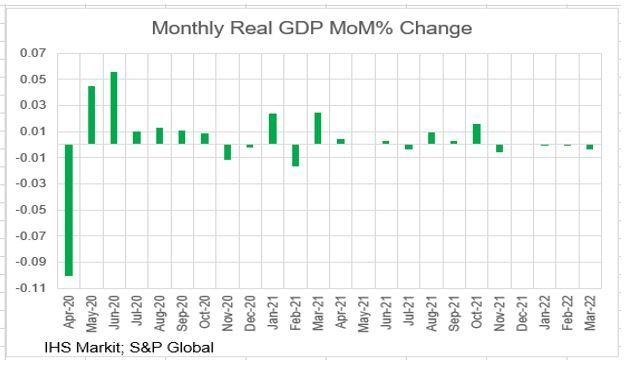
The markets seemed to initially ignore the -1.4% (annualized) real GDP print in Q1, the chart shows the percentage change in real GDP by month. Note that we haven’t seen positive real consumption growth since October when consumers purchased “early” for the holiday season due to the then rampant “shortages” narrative.
The University of Michigan’s Consumer Sentiment Surveys has indicated lower intentions to purchase big ticket items. We note that spending on durable goods fell -0.9% M/M in March, is down two months in a row (and down in four of the last five). Non-durable goods, too, were off -0.3% in March after falling -0.7% in February. This usually aligns with the housing market which is weakening
New and Existing Home Sales are falling. Why is this a warning sign? Because, people buy homes, cars and other big-ticket items on credit and these decisions are based on the consumers monthly payment for that purchase. So, let’s look at how this exactly impacts the economy. Home prices have risen significantly over the last year (the median home price rose from $326K to $375K over 12 months) and the rise in the 30-year fixed mortgage rate (3.1% to 5.5%), so the home the consumer could have purchased a year ago for $326K with $65K down and a monthly payment of $1,115, would now cost $375K, and require $75K down payment, the monthly payment would have skyrocketed $1703 this is a 53% increase which significantly impact monthly cash flows.
In addition, mortgage applications on refinancing have fallen off a cliff. Why is this a big deal? Because Refis are often a source of liquidity for major purchases, another reason we believe we will see, a notable slowdown in consumption.
The incoming data is not painting a pretty economic picture and it looks like a recession is unfolding. Once that recession is recognized by the business community, unemployment will rise significantly and the Fed will be at a cross roads. Either change a decade of poor monetary policy and push off the inevitable it will be forced to stop its tightening. We don’t think the Fed will ever get to its stated “terminal” rate, so markets, which have already priced-in such rates, will have to adjust to a lower rate. Under these conditions, bonds may be cheap, but you need to be able to stomach the volatility and the mixed noise from the media. Source Bob Barone Ph’D Economist
Technical Analysis Perspective
Over the last five weeks, the S&P 500 has fallen -8%. Six trading days ago (Friday, April 29th), the market index experienced its largest outlier day of the year, falling by -3.63%. Last week, it experienced both its second and third largest outlier days, as the index rose by +2.99% on Wednesday and fell by -3.56% on Thursday. On Monday, the S&P 500 dropped another -3%. In other words, volatility isn’t slowing down. Nearly one-third of all trading days in 2022 have been outliers. That is not bullish.
What has been worse for the average investor is the bond market. As investor money flows out of equities, it has not gone into bonds. Twenty-year treasury bonds (ETF: TLT) have also fallen for 5th consecutive week. Since 2002 (when the ETF began trading), this has only occurred eleven times, with two of those occurrences happening this year. While stocks fell -8% in the last five weeks, the long-term treasury bonds declined by -9%. A +/-1.50% day is occurring in treasury bonds about once per week on average.
The markets have been in a panic for most of this year. The Nasdaq index turned bearish on January 21st. The S&P 500 soon followed one month later. Volatility is extremely high right now and expect it to remain this way for the rest of the year. Keep in mind that all markets experience bearish periods including treasury bonds. Treasury bonds have been among the worst performers in 2022.
How do we deal with a bear market? Navigating a bear market requires a disciplined, systematic process that can maintain low volatility through “smart diversification.” It is not something an investor can deal with based on emotion or gut feeling.
In this volatile environment, hold several ETFs, each providing a unique purpose. These can range from sectors and industries to alternative investments and commodities. Some believe holding inverse ETFs, (which move in the opposite direction of the underlying index) may help reduce significant declines. Keep in mind this is only to be used as a hedge, insurance to prevent massive declines. A Buffered ETF may also limit downside, these funds buy both calls and puts so there is a limit on both sides. These innovative positions can create a more stable, efficient portfolio during a volatile period. The goal is to limit portfolio fluctuations within a range the investor can handle.
Remember volatility works in both directions. Bear markets are extremely sensitive, the tiniest bit of news can cause the markets to decline further and can also cause the markets to rise. You will see volatile, upward moves. The key for investors is to not be fooled into thinking a bear market is over and jumping back in blindly. Right now, we are only 4 months into the year.
The Week Ahead
Investors remain skeptical that the pace of interest rate increases won’t quicken. Even after Powell’s meeting comments, the futures market is still pricing in a nearly 80% probability of a 75bps lift in June. Those odds may swing after April’s U.S. inflation data is released, with CPI scheduled for Wednesday followed by PPI on Thursday. There are also a series of Fed member speeches throughout the week to parse. Ten and 30-year Treasury auctions will be scrutinized given the current rate environment. Other U.S. reports include the NFIB small business index on Tuesday, and May’s preliminary consumer sentiment numbers to close the week. Overseas, China will release a slew of figures, including trade and inflation data. Factory gate prices have been on the rise while consumer demand remains subdued. Britain’s Q1 GDP arrives on Thursday, and with the recent slump in retail sales and consumer confidence economists are expecting slower growth compared to the prior quarter. Finally, in the Eurozone, economic sentiment surveys land on Tuesday followed by industrial production accounts later in the week.
This article is provided by Gene Witt of FourStar Wealth Advisors, LLC (“FourStar” or the “Firm”) for general informational purposes only. This information is not considered to be an offer to buy or sell any securities or investments. Investing involves the risk of loss and investors should be prepared to bear potential losses. Investments should only be made after thorough review with your investment advisor, considering all factors including personal goals, needs and risk tolerance. FourStar is a SEC registered investment adviser that maintains a principal place of business in the State of Illinois. The Firm may only transact business in those states in which it is notice filed or qualifies for a corresponding exemption from such requirements. For information about FourStar’s registration status and business operations, please consult the Firm’s Form ADV disclosure documents, the most recent versions of which are available on the SEC’s Investment Adviser Public Disclosure website at www.adviserinfo.sec.gov/
The Optimized Investor
