
The Economy
Weekly Market Review from May 5th , 2023

The content of this Newsletter is to provide you with Economic insights to assist you in making better decisions with your investments. Unlike many other financial periodicals we will not mention specific companies, unless it is relevant to an overall economic issue. We welcome your questions on economic concerns and will address in our newsletter. just email us at info@optfinancialstrategies.com #FinancialAdvisor,#investmentmanagement #wealthmanagement #financialplanning #retirementplanning #401kplans
Week In Review
This past week the Fed raised interest rates another 25 basis points, this being the 10th consecutive month the FMOC raised rates. Fed chair Jerome Powell signaled a possible pause on further tightening, but stocks sold off when he said it might be too soon to lower rates. After Friday's labor market report showing the economy created another +253,000 jobs in April, the odds for a rate cut as early as July evaporated. Employers still reported 9.6 million job openings in March, according to Labor Department data released last Tuesday. Openings are down significantly from the record 12 million reported last March. However, despite the drop in openings, there is still a large imbalance between job openings and available workers.
3 of the 4 major indices were down for the week with the NASDAQ being the sole performer to post a positive number +.07% but we can say it was basically flat on the week. The DOW posted a -1.24% decline followed by the S&P -.80% and the Russell 2000 -.51%
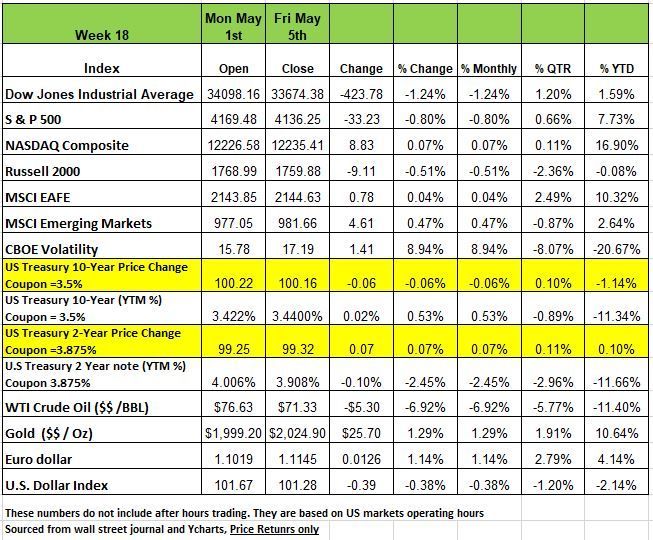
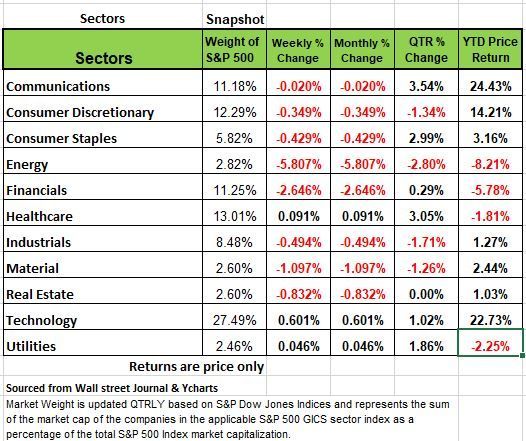
Nine of the 11 sectors came in negative for the week, weighed down by downbeat economic data from China and fears that a US recession would choke off demand for fuel, oil prices were down as much as 15% last week, dragging the energy sector 5.8% lower.
The banking sector also limped into Friday's close. JPMorgan (JPM) acquired First Republic Bank (FRC) last week, but PacWest Bancorporation (PACW) lost as much as 50% Thursday on reports the bank was exploring strategic options. Still, the regional bank's shares rebounded Friday, rising almost 82%. Fearing the inability to get regulatory approval, Toronto-Dominion (TD) and First Horizon (FHN) called off a $13.4 billion takeover, leaving First Horizon's fate in limbo. The financial sector fell by -2.6%.
Paramount Global (PARA) had its worst week in more than two years when dismal Q1 results coupled with a 79% cut to its dividend resulted in a 28% loss in the stock this week, contributing to a -2.3% decline in the communication sector.
Consumer discretionary, Consumer Staples and Material stocks also were on the defensive, though losses in the consumer discretionary sector were mitigated by strength in cruise operators, so consumers are still spending on vacationing.
Technology stocks pulled out ahead with the help from Apple (AAPL) which crushed Wall Street's earnings expectations. The sector was up 0.6% with chipmakers.
Economic Landscape
The FMOC raised the Fed Funds Rate by another quarter point last week, not much of a surprise to investors. This Lifted the “new” Fed Funds trading range between 5%–5.25%, this happens to be the highest rate since 2007 right before the Great Recession of 2008 or as we tend to say when the bottom fell out. There is no shortage of economic professionals voicing their opinion on the next move from Powell & the FMOC and this makes for a very speculative and volatile market environment.
With a 500 basis points (bps) in rate hikes over the last 10 months, the money and bond markets are currently operating under the assumption that Fed policy will now go into a holding pattern, a pause in raising rates. While the voting members did not outright say as much in their May FOMC policy statement, they did insinuate that pausing was a probable next move.
But keep in mind that the Fed gave itself an out, some flexibility just in case CPI becomes more stubborn than they think. The confusion or inability to be more decisive is to provide the FMOC with some options going forward. Keep in mind that this is very much like putting together a large economic jigsaw puzzle, only the pieces keep changing shape.
When it comes to future monetary policy decisions the question everyone is asking: now what’s next? First, the policy makers will take time to evaluate their decisions, weighing incoming economic and inflation data accordingly. Up to now, the economy has been showing signs of slowing, and investors could even see zero or negative readings for real GDP in upcoming quarters. But the U.S. consumer has been resilient and still spending, especially on vacation travel.
The Fed is still waiting to witness some visible evidence of the labor market softening, but this has become a tricky topic since the labor force seems to be shrinking with more people leaving the workforce, hence distorting the numbers. Remember if you are out of work and not looking for a job you are not considered part of the labor force, so you are not counted as unemployed. In addition, perhaps taking the place of additional rate hikes, the Fed also appears to be factoring in some restrictive forces by tightening credit conditions, even following the recent chaos with several regional banks.
This leaves us with the inflation side of the equation, whether it is measured by CPI (YOY), PPI or the Fed’s preferred PCE gauge, all metrics have revealed a cooling in price pressures. However, these official government readings for both headline and core inflation remain elevated to the central bank’s 2% tolerance mark.
The FOMC members must still emphasize their priority to continue to bring inflation down, they need to in order to maintain credibility, but that doesn’t always mean more rate hikes unless the data forces the Fed Governor’s hand. The monetary policy debate in the markets going forward is more than likely going to be centered on the timing for rate cuts. Presently, that’s where the disconnect lies between the FOMC and the money and bond markets. At this juncture, the Fed does not appear to have rate cuts on its radar, let alone the multiple-cut scenario found in the implied probability for Fed Funds Futures.
It is now the bet by investors that the Fed is in “pause” mode, investors are going to have to wait and see just how long this part of the policy process lasts. Policy makers do not want to get into a position where they have to begin raising rates again if they sit still on the sidelines too long or pull the trigger to quickly and pivot with rates cuts. We think that communication from here on out is going to be a bit challenging because the potential for the markets to misinterpret FOMC’s intentions will most likely be exaggerated in prices of securities. So, we believe that heightened volatility in both the bond & equities market should remain a part of the investment landscape for the near future.
With all of the layoffs announced over the last few months one should be curious why the unemployment rate is moving down to 3.4%, not up. This happens to be the lowest level since 1953. In the year before the presidential campaign season, we know that politicians will take credit for something that they have nothing to do with. The part of the puzzle that intrigues us is why or how are these recently unemployed able to drop out of the labor force. One thought is that many of these layoffs came with some sort of severance package so the younger unemployed may not be so anxious to replace their lost income.
Markets were expecting a payroll number of about +185K, the number came in at +235K, so a substantial beat. What wasn’t mentioned in the media was the downward -146K revisions to February and March data. So, on net, the actual growth from the old March number was +104K, -81K lower than what the market forecast was.
In past we’ve talked about the Birth/Death model “add-on.” This is the number that is just added (not counted anywhere) because BLS doesn’t survey small businesses. That number for April was +176K. So, the actual counted number was +77K (253-176). Adjusting for the -146 downward revisions for February and March, the net number turns out to be -72K. So, this really is not such a strong employment number.
Other employment indicators that give us some concern:
- In the Household Survey, non-agricultural and salaried employment fell -96K in April.
- The workweek (for nonsupervisory employees) shrank again in April (-0.3%) and has been flat or down in 13 of the past 14 months (down to 33.8 hours/week vs. 34.1 a year ago).
- Temp-Help Agency employment fell -23K in April and is down -139K over the past six months. The labor market can’t be very strong when the headhunters are cutting their own heads!
- The latest JOLTS (Job Opening and Labor Turnover Survey), a favorite of Fed Chair Powell, showed job openings contracted -384K in March (down three months in a row), hiring fell (-1K in March, -117K in February), quits were down (-129K and down in three of the last four months), and layoffs were up (+248K).
- In the S&P 500 quarterly reports, for the first time since mid-2021, the mentions of “job cuts” were higher than those of “labor shortages.”
It is very hard to get accurate information in this environment, especially if you are not schooled in this discipline, to uncover the manipulation of both data and information provided by various medica outlets. The National Bureau of Economic Research (NBER) is the official agency that will declare economic conditions, but they are always after the fact. The agency is full of academics and all they do is look at data, all lagging information and by the time they get around to announcing a recession we will most probably be coming out of it. Here is some of the information we gathered that leads us to our opinion.
The Conference Board’s Leading Economic Indicators (LEI) peaked in December 2021 and have been negative in every succeeding month, i.e., 15 months in a row.
Retail sales fell -1.0% in March after a -0.2% fall in February. Department stores were off -2.5% (-3.7% February). Clothing -1.7% (-2.0% February), The longer people continue to work at home the more certain industries will be impacted, Fashion is not a good bet at the moment since many people that purchased the latest styles are not in much or a need. Autos -1.6% (-1.3% February and down in four of the last five months), Building Materials -2.1%, and even Groceries -0.1% (and down in three of the last four months)
The transportation company, J.B. Hunt said in their quarterly report that the U.S is in a “freight recession.” Truck cargo volume is down -13% Y/Y. April’s railway car loadings fell -3.4% from March, and activity at the Ports of LA and Long Beach are off -25% Y/Y and -30% Y/Y respectively. In addition, shipping rates have fallen dramatically.
All the Manufacturing Surveys show weakness. The latest Richmond Fed Survey (April) was -10, and the Philly Fed’s latest was -22.8. The ISM Manufacturing Survey was 47.1 in April, having contracted now for six months in a row (i.e., <50). The Chicago equivalent has contracted for the past eight months.
Lastly U.S. credit card debt hit a record 1.24 trillion it grew by $17.6 in March 2023 with younger Americans having the highest delinquency rate. This is a sign that the consumer has not tapered its spending and continues to over buy than their budget allows. At some point in time these credit lines will be cut off as delinquencies continue to rise.
Technical Analysis
For those new readers to our newsletter technical analysis is an investment strategy /trading discipline that relies on identifying opportunities by analyzing statistical trends gathered from trading activity, such as price movement and volume. While no one can identify the bottom and peak price of a security, technical analysis tries to identify opportunities close to it.
Apple is the largest stock in the S&P 500. Shockingly, Apple’s market capitalization is larger than the smallest 198 S&P 500 stocks combined. Its large, upward move so far in 2023 has contributed heavily to the market index’s performance. So goes Apple, so goes the market. It carries the most weight of the index
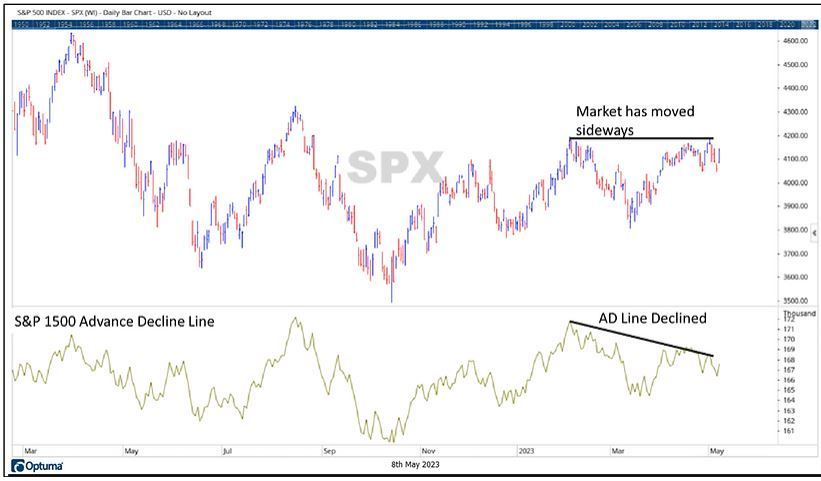
This has led to a recent, slight divergence in market breadth. Market breadth measures the number of stocks advancing versus declining. The chart below shows the S&P 500. The lower third of the chart shows the S&P 1500’s (largest 1500 US stocks) Advance Decline Line (AD Line). While the S&P 500 has moved sideways for the last three months, you can see that the AD Line has reached a lower peak-- a negative divergence. So, the majority of stocks did not rally much off of the market’s March lows.
This negative divergence makes some sense when looking at sector leadership. The S&P 500’s largest sector is Information Technology, accounting for 26% of the index’s market capitalization. On a risk-adjusted basis, the sector ranks third, just behind Communications, in terms of relative strength among the eleven S&P 500 sectors. Currently, six of the eleven sectors are in what we would define as a “Bull Market State” or low risk market environment. Those six sectors account for 67% of the index’s market capitalization. So, if you have a large sector leading the markets, while a third of the index is in a Bearish or Transitional Market State, it is logical that market breadth shows a negative divergence.
Over the past few months, the market has seen declining breadth, but has moved sideways. This means that a few larger market components are carrying the S&P 500 higher, while the larger population of smaller stocks retreats. This, however, has only been a short-term trend and is not yet a sign of long-term weakness. Right now, technology-related stocks are leading. Markets tend to do better when this occurs, as technology stocks make up the largest percentage of market capitalization.
Source Brandon Bischoff
The Week Ahead
This week’s economic calendar is considerably less crowded this week, following last week Press Conference with Powell and the jobs data, but contains a few important pieces of information. The big news many will be waiting to see is the the U.S., inflation update with April's CPI on Wednesday and producer prices on Thursday. Headline CPI fell from 6% in February to 5% in March, but core prices were stickier than expected. The disinflation process may be losing some momentum, but softening rent and home prices may start to factor in soon. President Biden meets with congressional leaders with the budget and debt ceiling negotiations on the table. Yields on Treasury bills for early June have soared firmly above 5% as Secretary Yellen has warned of funding limitations that may begin in a month’s time. There are 10- and 30-year Treasury auctions this week, and May’s preliminary consumer sentiment and inflation expectations round out the domestic agenda.
Overseas, monetary policy focus shifts to the UK on Thursday, where a 25bps hike is priced in with inflation still running above 10% annually. The Bank of England’s outlook may hinge on Friday’s GDP report, which is expected to reveal a sliver of growth. In Asia, China releases trade data, new loans, and inflation figures, while the Bank of Japan’s Summary of Opinions from Governor Ueda’s first meeting could merit some attention.
This article is provided by Gene Witt of FourStar Wealth Advisors, LLC (“FourStar” or the “Firm”) for general informational purposes only. This information is not considered to be an offer to buy or sell any securities or investments. Investing involves the risk of loss and investors should be prepared to bear potential losses. Investments should only be made after thorough review with your investment advisor, considering all factors including personal goals, needs and risk tolerance. FourStar is a SEC registered investment adviser that maintains a principal place of business in the State of Illinois. The Firm may only transact business in those states in which it is notice filed or qualifies for a corresponding exemption from such requirements. For information about FourStar’s registration status and business operations, please consult the Firm’s Form ADV disclosure documents, the most recent versions of which are available on the SEC’s Investment Adviser Public Disclosure website at www.adviserinfo.sec.gov/
The Optimized Investor
