
The Debt Ceiling, Economic Landscape &
A Weekly Review of the Markets
for May 15th, 2023

The content of this Newsletter is to provide you with Economic insights to assist you in making better decisions with your investments. Unlike many other financial periodicals we will not mention specific companies, unless it is relevant to an overall economic issue. We welcome your questions on economic concerns and will address in our newsletter. just email us at info@optfinancialstrategies.com #FinancialAdvisor,#investmentmanagement #wealthmanagement #financialplanning #retirementplanning #401kplans
Week In Review
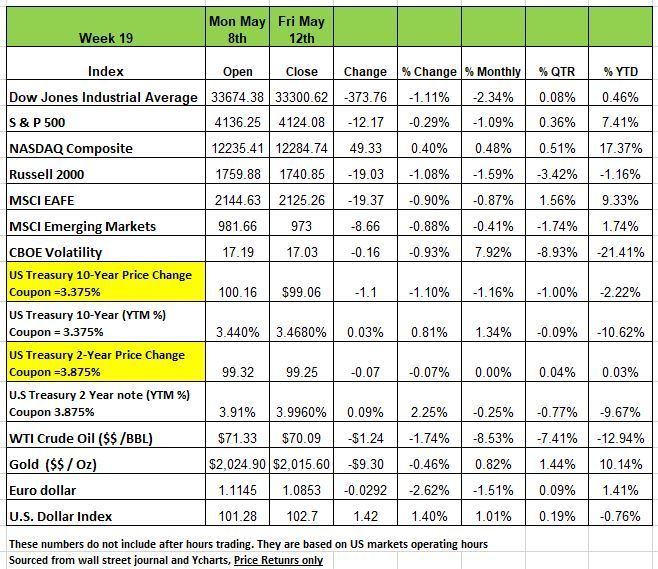
Three of the 4 major indices were down last week with NASDAQ being the sole outlier with a +40 basis point increase over the previous week. The DOW had the largest decline of -1.11% followed by the Russell 2000-1.08% and the S&P 500 index -0.3% as investors weighed concerns about the US debt ceiling against data indicating inflation slowing on a yoy basis.
The slight decline came as worries about the US debt ceiling not being raised and Treasury Secretary Janet Yellen stating that the US government could default if Congress doesn't raise the debt limit.
Still, investors were encouraged by data indicating inflation may be slowing. The April US Producer Price Index rose less than expected, and less than in March. The US Consumer Price Index, another key measure of inflation, rose by 4.9% in April from a year earlier, the Labor Department said, marking a slowdown from a 5% increase in March.
Yields on Treasuries were weak early last week as inflation and economic data were mixed. The 2-month Treasury, however, experience large relative price action as Congressional Leadership and the President continue to play games on the debt ceiling. Treasury Secretary Janet Yellen declared that the federal government would have to renege on promised congressional outlays if Congress cannot come to agreement on raising the debt limit. She stated on Bloomberg Television, “If Congress fails to do that, it really impairs our credit rating. We have to default on some obligation, whether it’s Treasuries or payments to Social Security recipients.” What we find interest here is that a default will not happen on treasuries that will always be a priority in the U.S. obligation. But as in the past government employees will not get paid or other contractors, but this does not lead to enough sensationalism to get people concerned. This is not the first time the US has struggled with the debt ceiling and that we eventually keep raising it. At some point, probably in the near future, the debt obligation of the U.S. will be much like that of a zombie company it will be too great to pay off.
Last week’s economic data included the April Producer Price Index registering a smaller than expected expansion giving rise to hope that inflation continues to temper. The week ended with Friday’s preliminary University of Michigan consumer sentiment survey showing 5–10-year inflation expectations at 3.2% - well above the Federal Reserve’s target 2% rate. Treasury yields spiked on Friday as a result.
Crude Oil continues to go lower and Brent crude, the global oil benchmark, has seen a 13% fall year-to-date. Supply has been strong to start 2023 and while OPEC and the IEA expect the 2H of 2023 to see demand begin to outpace supply, market price action seems to have taken the other side of the supply/demand trade on recession fears.
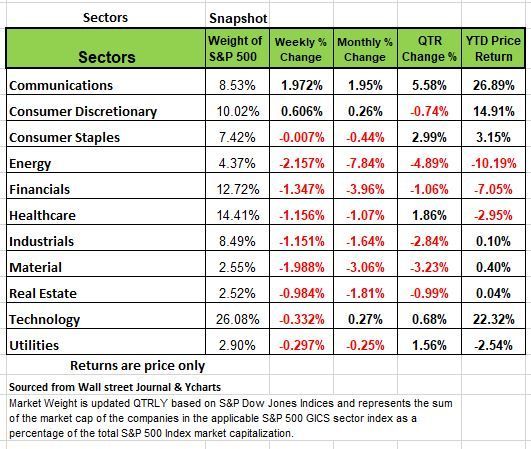
All but two sectors fell last week. The energy and materials sectors had the largest percentage drops for the week, shedding 2.15% and 2%, respectively. Other sectors down by more than 1% each included financials, health care and industrials as indicated in the chart below.
Just two sectors rose on the week -- communication services climbed 4.3% and consumer discretionary edged up 0.6%.
The energy sector's drop came as crude oil futures declined from last Friday's closing level. Decliners included shares of Occidental Petroleum (OXY), which fell 4.3% on the week as the company reported Q1 adjusted earnings per share below analysts' mean estimate while revenue also missed the Street view.
In the materials sector, shares of International Flavors & Fragrances (IFF) shed 14% as the company reported Q1 adjusted earnings per share below analysts' mean estimate despite higher-than-expected revenue. International Flavors & Fragrances also forecast Q2 sales below the Street view and cut its full-year sales guidance.
Among the sectors in the red this week, consumer staples had the smallest percentage decline, but it might have been in positive territory if not for a nearly 20% tumble in the shares of Tyson Foods (TSN) that marked the stock's worst weekly performance since November 2008. The slide in Tyson's shares came as the meat producer reported it swung to an unexpected adjusted net loss in its fiscal Q2, while sales also missed analysts' expectations. The company also cut its fiscal 2023 sales guidance.
On the upside, the gainers in communication services were led by shares of Google (GOOGL, GOOG), which rose 11% amid the company's annual development conference. At the event, Google said its Google Search volume has been uninterrupted by artificial-intelligence rivals.
This week, companies expected to release quarterly earnings results include Home Depot (HD), Cisco Systems (CSCO), TJX Cos. (TJX), Target Corp. (TGT), Walmart (WMT), Alibaba Group Holding (BABA) and Deere (DE).
The Economy
It’s hard to look at any media outlet these days and not see a story that is sensationalizing the issues with the debt ceiling. The Biden Administration is saying that a “default” is approaching if an agreement isn’t reached soon, and we mentioned above even Treasury Secretary Janel Yellen went on television to warn the public of the consequences. This seems like politics have gone too far in the running of our country. Let’s be clear the US has enough revenue to pay all bondholders, but what a roughly $1.5 trillion deficit this year means is that if the debt ceiling isn’t lifted, it won’t be able to pay all its obligations, so remember obligations also mean entitlements, especially to those able body Americans that just do not want to work anymore. The U.S. has far more concerning issues on the horizon, and we will focus on the economics issues.
The U.S. economy showed fresh signs of cooling, with a reading of supplier inflation (PPI) moderating and applications for unemployment benefits rising. The Producer Price Index (PPI), another leading indicator of the direction of inflation, rose +0.2% in April (a rather mild +2.3% Y/Y) with drops in food cost (-0.5%), construction costs (-0.3%) and a significant fall in transportation/warehousing (-1.7%). Transportation represents the pulse of the economy as goods must move from their place of production or their ports of entry to hundreds of thousands of places in the U.S. where consumers shop. The fact that transportation prices are falling simply means fewer items being shipped or weakening demand.
This marked the slowest pace since January 2021 and an easing from March’s 2.7% rise. Softening supplier inflation can signal an easing of consumer prices, but remember it’s not often that prices recede, that just don’t rise.
Last week the BLS released the most recent number on the Consumer Price Index (CPI). Prices rose +0.4% in April (4.95% Y/Y). The media focused on the YOY decline. However, Core services (ex-housing), an important sub-index for the Fed, came in a little hot at +0.4% M/M (vs. +0.3% in March). The question is whether or not this will continue and this will depend on the consumer. We do not think this alone will cause the Fed to raise rates again when it meets in mid-June (13th & 14th) because signs of disinflation are emerging. Our reasoning for this is that the Bureau of Labor Statistics (BLS) uses data for used cars and rents that are several months old. So, these numbers are not all that current, so, if we just cut out used car prices and rents, which we see are falling, and set them at 0%, the CPI would have deflated -0.1% in April. Better yet, if we substitute the Manheim Index for used cars and the Apartment List Index for rents, then this measure of the CPI would have deflated -0.4% in April!
In addition, the CPI had a low comparative base in April 2022. Over the next two months, that base rises dramatically. So even if M/M inflation comes in hot, even at +0.5% M/M, June’s inflation rate would fall to 3.4%. And if CPI is flat (0%) in May and June, the Y/Y rate of inflation will fall into the mid +2’s. So, you can see why we are solidly in the deflation camp.
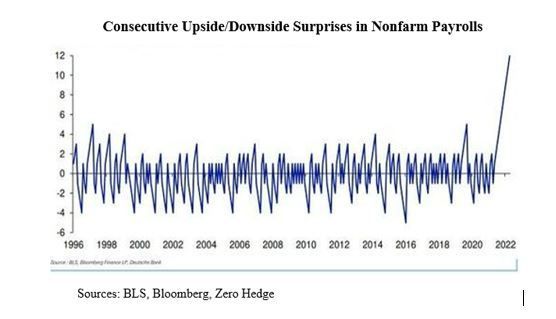
When it comes to the payroll numbers, we know that there are some distortions we are presented with in this area. Markets and the media take the Seasonally Adjusted (SA) Payroll Data at face value. The chart below shows a timeline, beginning in 1996, of consecutive Upside/Downside differences between the originally reported Payroll data and the Bloomberg consensus estimate. For example, if the consensus is +200K and the reported SA data is +250K, that counts as an “upside.” If that happens three months in a row, and then a “downside” occurs, the charted point would be “3”. Note that the highs were “5” in 1997 and 2020. That is, until the recent run of “13”!
Other economic data
In March, Real Consumer Spending (adjusted for inflation) fell -0.3%. In February, that number was down -0.5% and has been down now in four of the last five months. We will see what happens this week as April numbers are due out. January was responsible for all of Q1s consumer growth (likely weather related). The start of Q2 was quite weak. Below are some other points that give cause for concern:
The National Federation of Independent Businesses (NFIB) has a monthly Business Confidence Survey. In April, that index was 89.0, down from March’s 90.1, and below Wall Street’s overly optimistic consensus estimate of 89.7. What is of interest here is that this index was much higher entering the last four Recessions: March ’08: 90.1; September ’01: 96.2; July ’90: 97.9, and in the 1982-82 Recession chapter, the lowest level was 94.4.
In March, there was a surge in credit card debt (+$17.6 billion), the fourth largest surge since 1968. Interest rates on credit cards are in excess of 25%. The average balance per household has risen to $3,500 in March from $3,000 a year earlier. Six percent of accounts are now 30 days late which equals the pandemic high. These kinds of increases usually occur when the consumer doesn’t have enough cash and is trying to maintain a standard of living. The increase far exceeds anything attributable to inflation. In our view, this is an ominous sign. It portends rising credit card delinquencies, something else the beleaguered banks will have to deal with.
Everyone is aware of the recent bank failures. There is ongoing volatility in the equity values in that sector, especially among the Regional Banks. The chart above shows the percentage of banks tightening credit in Q4, Q1 and Q2. Note that, except for mortgages, banks were tightening credit prior to the recent banking fiascos and that they have clearly tightened credit standards much more since. This impacts economic activity in a relatively short period of time, like a quarter or two. We are seeing the reason for such tightening in the delinquency stats. Auto loan default rates, for example, were 2.0% in Q4. They rose to 17.3% in Q1 and are now at 27.5% (Q2). That leads us to believe that the rise in credit card debt is due to consumer stress.
The Fed recently released its Q2 SLOOS (Senior Loan Officer Opinion Survey) and its Semi-Annual Financial Stability Report. The major takeaways from these reports are as follows:
· Commercial Real Estate (CRE) has become a major risk; Regional and small banks have significant exposure to this segment.
· Rate increases raise the risk that CRE borrowers will not be able to refi (a significant portion of these loans come due every year);
· There are concerns over elevated CRE loan/value ratios;
· Because of the turmoil in the banking sector, the pullback in lending will only exacerbate the oncoming Recession.
Once again neither the financial media nor Wall Street commentators have raised much stink about the possibility of a default by the Treasury if the debt ceiling isn’t raised. Each party appears uncompromising. Treasury Secretary Yellen stated that early June appears to be the deadline. However, there are tricks that can be tried, like minting a $trillion coin, or invoking the 14th Amendment to the Constitution which states that the U.S. shall not default on its obligations. We don’t know what’s going to happen here. Like everyone else, we hope a compromise is reached before any events of default. But we expect the markets to become more volatile as we get closer or [ass the deadline. Could be an opportunity for the brave. Source Bob Barone Economist PhD
A Technical Perspective
For those new readers to our newsletter technical analysis is an investment strategy /trading discipline that relies on identifying opportunities by analyzing statistical trends gathered from trading activity, such as price movement and volume. While no one can identify the bottom and peak price of a security, technical analysis tries to identify opportunities close to it.
While most U.S. equity indexes are stubbornly stuck under resistance, the Nasdaq-100 Index (NDX) finally broke out to the upside. This year, NDX is up 22%, with the S&P500 only up 7%+. Driving the outperformance is the NYSE FANG Index ($NYFANG), up a whopping 43% YTD. Since NDX is a market cap-weighted index, the 10 stocks in $NYFANG make up just over 50% of its larger cousin’s market value. That means virtually all NDX’s YTD gains can be attributed to $NYFANG. The remaining NDX components are essentially flat, and that narrow leadership has some investors concerned for the market’s overall health.
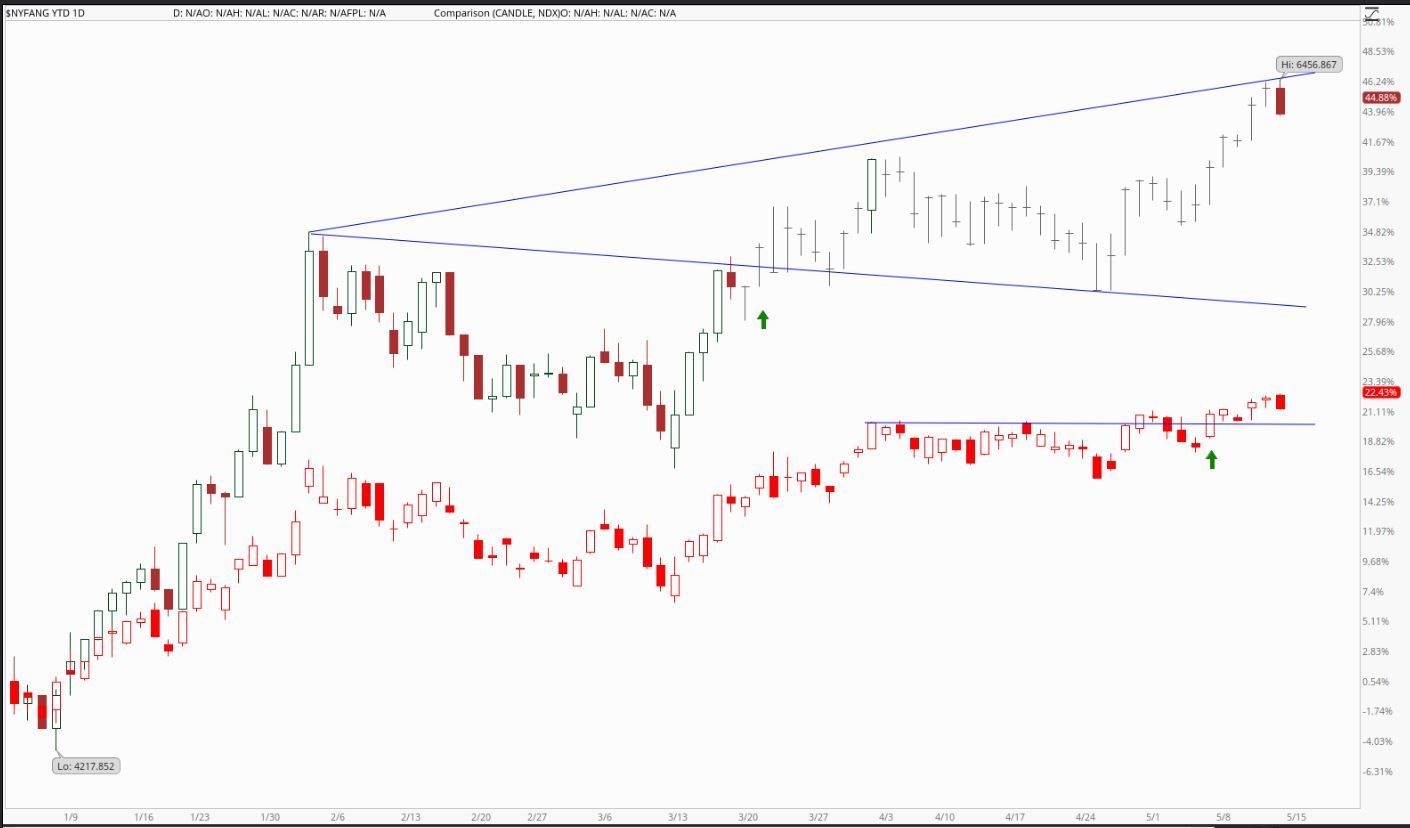
While the current trend is upward investors need to be careful if the economy takes a more negative downturn the shift in these leading companies could make declines even more costly.
The Week Ahead
The focus this week shifts away from central banks and inflation and towards the health of U.S. consumers. On Tuesday’s retail sales report for April is expected to show a return to growth, as spending has remained resilient in the face of high inflation and banking sector turmoil. There are also earnings results to consider from top retailers Walmart, Target, and Home Depot. Debt ceiling negotiations are scheduled to resume on Tuesday. The stressed U.S. manufacturing sector will feature regional survey updates from the east coast.
Other U.S. events include industrial production, housing starts, and existing home sales. Fed Chair Powell will deliver a speech Friday at a conference in Washington DC.
Moving overseas, in Europe, the final estimates of Q1 GDP and April CPI will be bookended by industrial production and German PPI figures. Australia features the Q1 wage price index, employment numbers, and minutes from the recent RBA meeting. Finally, expectations are sky high for China’s April retail sales and industrial production releases, even as recent business surveys have indicated some softening.
This article is provided by Gene Witt of FourStar Wealth Advisors, LLC (“FourStar” or the “Firm”) for general informational purposes only. This information is not considered to be an offer to buy or sell any securities or investments. Investing involves the risk of loss and investors should be prepared to bear potential losses. Investments should only be made after thorough review with your investment advisor, considering all factors including personal goals, needs and risk tolerance. FourStar is a SEC registered investment adviser that maintains a principal place of business in the State of Illinois. The Firm may only transact business in those states in which it is notice filed or qualifies for a corresponding exemption from such requirements. For information about FourStar’s registration status and business operations, please consult the Firm’s Form ADV disclosure documents, the most recent versions of which are available on the SEC’s Investment Adviser Public Disclosure website at www.adviserinfo.sec.gov/
The Optimized Investor
