
Are the Markets Heading toward a Downward Spiral
Weekly Market Review
from April 28th, 2023

The content of this Newsletter is to provide you with Economic insights to assist you in making better decisions with your investments. Unlike many other financial periodicals we will not mention specific companies, unless it is relevant to an overall economic issue. We welcome your questions on economic concerns and will address in our newsletter. just email us at info@optfinancialstrategies.com #FinancialAdvisor,#investmentmanagement #wealthmanagement #financialplanning #retirementplanning #401kplans
Week In Review
Three of the 4 indices end the week and the month in positive territory with the exception of the Russell 2000.
The NASDAQ led the charge last week with a +1.28% return but was basically flat for the month of April with +.04% return. The S& P 500 index edged up +0.87% last week as did the DOW +.086 on stronger-than-expected quarterly earnings boosted the communication services and technology sectors and helped the two indices end the month of April with gains of +1.46% and +2.48% respectively. The Russell 2000 is still struggling down -1.26% for the week and -1.86% for the month as smaller companies struggle with rates increases and last weeks issues with First Republic gave pause to think perhaps the financial issues will persist in more smaller banks.
The week's slight gain came as better-than-expected Q1 financial results from some companies outweighed disappointing reports from others. Economic data appeared to move in the right direction but had some caveats. Q1 gross domestic product showed the US economy expanded last quarter but only by 1.1% on an annual basis, which was much smaller than Q4's 2.6% expansion. The report showed consumer spending propped up the economy in the first quarter while businesses pulled back on capital investments and drew down inventories. Inflation data released Friday showed the core Personal Consumption Expenditures (PCE) Price Index, the Fed’s preferred inflation gauge, rose 4.6% in March compared to last year. That was in line with expectations. The inflation data reinforced expectations that the Federal Reserve will raise interest rates by a quarter point when it meets on Tuesday and Wednesday this week.
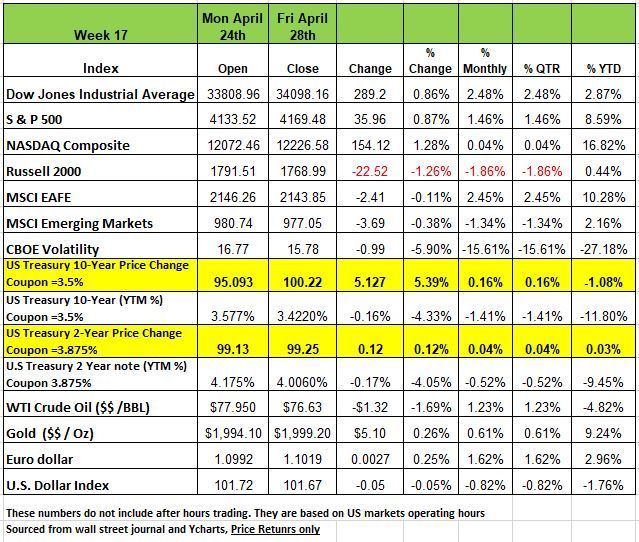
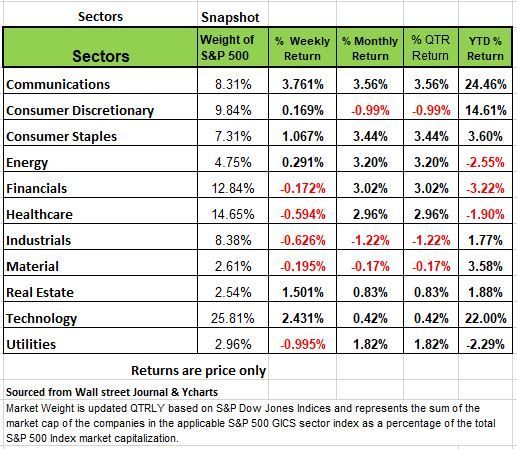
By sector, communication services had the largest percentage increase of the week, up 3.8%, followed by a 2.4% increase in technology. Real estate, consumer staples, energy and consumer discretionary also posted weekly gains.
In the red, meanwhile, utilities fell 1%, followed by declines of 0.6% each in industrials and health care. Financials and materials also declined.
The advance in communication services was led by shares of Facebook parent Meta Platforms (META), which jumped 13% on the week. The social network operator, which also owns Instagram and WhatsApp, reported Q1 results above Street consensus estimates and issued a stronger-than-expected revenue outlook for the current quarter.
The technology sector's climb was led by shares of Microsoft (MSFT), which rose 7.5% as the software company also reported stronger-than-expected quarterly results. Microsoft's fiscal Q3 earnings and revenue both topped Street views as its intelligent cloud segment's sales jumped.
On the downside, the utilities sector's decliners included shares of FirstEnergy (FE), which reported Q1 adjusted earnings per share a penny below the Street consensus estimate despite higher-than-expected revenue. The company also forecasting Q2 EPS below the mean estimate of three analysts polled by Capital IQ. Shares slipped 2%.
The drop in industrials came as shares of Old Dominion Freight Line (ODFL) fell 8.2% amid weaker-than-expected Q1 earnings per share and revenue from the truckload shipping company.
Also weighing on industrials, shares of United Parcel Service (UPS) slid 7.9% as the package delivery company reported Q1 results slightly below market expectations and trimmed its full-year revenue outlook.
In health care, shares of AbbVie (ABBV) shed 7% as the biopharmaceutical company reported Q1 adjusted earnings per share and revenue below analysts' mean estimates. While the company raised its guidance for full-year adjusted EPS, AbbVie said it is discontinuing its cystic fibrosis program as well as studies of its ABBV-154 treatment candidate in polymyalgia rheumatica and Crohn's disease.
This week's earnings calendar features companies such as Pfizer (PFE), Advanced Micro Devices (AMD), Starbucks (SBUX), Apple (AAPL), Anheuser-Busch Inbev (BUD), ConocoPhillips (COP) and Berkshire Hathaway (BRK.A, BRK.B).
Economic data expected earlier this week include April manufacturing and service sector data from the Institute for Supply Management as well as March construction spending and factory orders and construction spending. However, investors will be most focused on a two-day meeting of the Federal Open Market Committee as well as April employment data. ADP is set to release April private sector employment numbers on Wednesday while the US Labor Department's April nonfarm payrolls and unemployment rate are due on Friday.
Economic Landscape, Exercise Caution in Equities
Bloomberg Intelligence reported that one week into earnings season, 89 companies representing 20% of the S&P 500's market cap had reported earnings for Q1'23. Results thus far have been better than initial forecasts. The index is on track for a year-over-year earnings per share (EPS) decline of 7.3% vs. the forecast of -8.1%. Earnings beat rates for the quarter have been better than average as well. So far, 77% of reporting companies beat EPS estimates compared to the five-year pre-pandemic average of 73%. However, keep in mind that this far the consumer has been resilient with the cost associated with borrowing. This week the Fed will have its FOMC meeting and Wednesday we expect Chair Fed Powell to announce another 25-bps interest rate increase. The markets will be focused more on his narrative regarding the condition of the U.S. economy. Right now, we feel that the stock and bond markets are saying different things. That disjunction will create opportunities for some disciplined investors, and many are shorting U.S. large-cap equities, expecting a significant decline.
We think investors need to be careful in the equity markets. It appears that the bond market is predicting a recession and the equity market has not priced that in just yet. One of the problems people have with time is that we tend to think good times will last longer than they do, and bad times will be forever. We are creatures of conditioning and in today’s world with sensationalizing of information it takes longer to respond to change. This is one reason why investors tend to buy high and sell low.
For nine of the last fifteen years, few people thought about the Fed. Yes, on occasion, we discussed QT and QE, but the Federal Reserve held interest rates at near zero year after year. In 2017 and 2018, they lifted rates, and it became the topic of conversation, even former President Trump voiced his opinion. Then they cut rates back to zero and the noise went away. Now, with rates headed up, all eyes are again on the Fed, as investors are parsing every word from Fed Chair Powell.
The consensus among economists is forecasting for a recession, but earnings forecasts have not incorporated that expectation. The bond market is signaling danger. The yield curve and the Fed funds forward rates are predicting six or seven rate cuts in the next two years. But the equity markets seem to be ignoring those signals.
The danger of a recession is driven by the Fed’s policy in response to rising inflation and by weakness in certain sectors of the economy, such as commercial real estate. The U.S. got to this point following a period of “secular stagnation,” a term coined by form Treasury secretary Larry Summers when the economy was characterized by an excess of savings relative to investment. This happened back in 2013 which kept interest rates low, slowed growth and drove down inflation.
But the pandemic changed all of that, many people who received free money stopped working and took it easy. They bought whatever they wanted. Many left the workforce creating a labor shortage.
The inflation we are seeing was caused by poor monetary policy and fiscal policy. Blame Washington D.C. Some academics will argue that inflation is the result of the COVID related supply chain issues and corporate greed. But the main cause is still consumer demand, without the increase in demand we would not have supply issues. The demand is a result of irresponsible personal financial management.
Many economists feel that Inflation will remain in the 5% range as long as the labor market remains tight. The U.S. went from 2% to 5% inflation over the last year, and the rest can be attributed to noise – like temporary spikes in gas prices.” From the Russia Ukraine conflict
It may be difficult to get to 2% inflation until the economy slows down and the imbalance in the labor market readjusts.
So, what’s the problem with 4% to 5% inflation? The main issue is that people don’t feel so great. Prices are rising faster than wages, meaning real wages are lower and purchasing power is reduced. Last year when gas prices hit $6 in Chicago people were taking pictures of the gas pump and posting them on social media, in shock of paying over $100 to fill up the gas tank. People tend to need clarity in numbers and want specific targets like 2%, and they also remember what you said, so specific forecasts can be dangerous, especially as we approach an election year.
As we mentioned, the markets expect the Fed to raise rates by 25 basis points this week, it has signaled that it would. The markets also believe that the Fed will signal that it is “agnostic” about future rate hikes as it has in the past relying on the incoming information and being data dependent. Keep in mind that the data is driven directly by us, the consumer, the more we want now the more it will cost as inflation continues to be a struggle to tame.
The Fed does also have a little problem, it has lost some of its credibility for several reasons, first by stating that inflations was transient and also because it got “behind the curve” in fighting inflation. It will take a little time in order for that credibility to be restored. We also want to note that the Fed does not have an easy job. The Fed’s challenge is time, changes do not happen overnight and in a world driven by irresponsible media looking to create controversy consumers do not always receive accurate information. In addition, tightening credit conditions following the SVB and First Republic crisis makes it more difficult, how many smaller institutions may fold is not clear how much this will affect Fed policy and interest-rate increases.
We are also seeing more defaults in the commercial real estate market, which is complicated by a shift in our working and living conditions. We know that it will be harder to borrow, property prices will fall, collateral will be worth less, lending will be constrained, commercial rents will be driven down, and as valuations fall further, the cycle will perpetuate. There are many that believe the work from home model is here to stay, but we still believe for the majority of employers this is a temporary condition because productivity has declined. When computers promised to help employees be more efficient and that our workday would be reduced, we saw the opposite, employers load more work on their staff and many people went from a 5-day work week to 6 days. Another piece of evidence is that weekday golf has risen with more employees not needing to report to the office.
A Technical Perspective
For those new readers to our newsletter technical analysis is an investment strategy /trading discipline that relies on identifying opportunities by analyzing statistical trends gathered from trading activity, such as price movement and volume. While no one can identify the bottom and peak price of a security, technical analysis tries to identify opportunities close to it.
The streak of 22 trading days without an outlier +/- 1.5% movement ended last Tuesday, as the S&P 500 experienced a -1.58%. Two days later, on Thursday, came another outlier day, with the market rising +1.96%. Last week, we noted that this was a possibility.
So, what does this mean? How was an outlier day not unusual, short-term volatility (as measured by the 10-day Volatility Index or VI), reached its lowest point since November 2021. Longer term volatility had declined to its lowest level since the beginning of 2022. This can be like the squeezing down of a spring, eventually, the market will let off some pent-up pressure in the form of an outlier day.
While the market index experienced a downward outlier day, it countered with an outlier day to the upside. Those who pay little to no attention to the market’s fluctuations would not have noticed the two large daily moves. Even with two outlier days, the market’s final result for the week appeared to be stable.
We also noted that not only has the frequency of outlier days declined in 2023, but so has the extent of those outliers. Last year, the market experienced 75 outlier days of at least +/-1.50%. Neither of the two outlier days seen last week would have been in the top 50 largest outlier days from last year. While all outlier days are emotional, so far, the outliers seen in 2023 have been much less erratic.
As of Friday, the S&P 500 was still hovering around a point of resistance. That means it is currently in a spot that it cannot seem to break above. This can be interpreted as a lack of confidence in the direction of the economy. The same is true for some of the market’s largest sectors. Charts of the S&P 500 as well as the Information Technology, Communications, and Consumer Discretionary sectors can be found below.
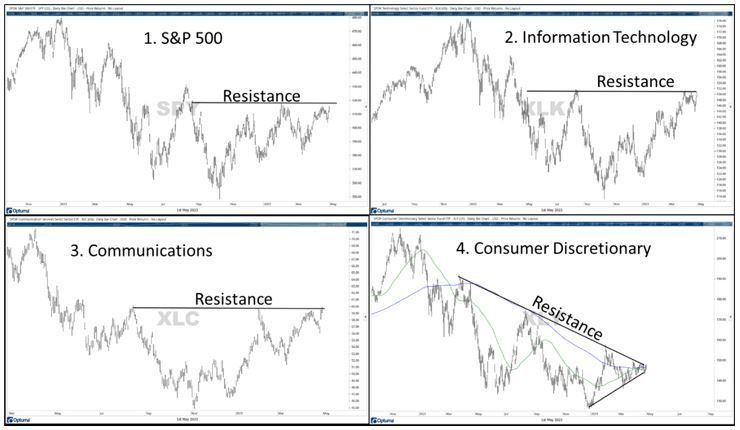
Chart #1 depicts the S&P 500, which is currently sitting at a point of resistance, after experiencing the two outlier days mentioned earlier.
Chart #2 shows the Information Technology sector. This is the largest individual market sector and contains stocks such as Apple and Microsoft. It is also currently at a point of resistance.
Chart #3 shows the Communications sector, which contains stocks such as Google and Meta (Facebook). It led the market’s “upward” outlier last week. The outlier day to the upside concluded at a point of resistance that intersects a few of the sector’s prior peaks.
Chart #4 shows the Consumer Discretionary sector. This sector’s largest components include Amazon, Tesla, and Home Depot. You can see the sector’s resistance line has been drawn diagonally across prior peaks. In addition, it has an increasingly lower support line. The sector’s price is at an intersection between resistance, support, it’s 200-day moving average, and 50-day moving average.
Each of these charts is now sitting at a point of resistance that it is attempting to break above. Collectively, the three technology-heavy sectors shown above account for 44% of the S&P 500’s market capitalization. In other words, whichever way these three sectors go, whether they bounce down off upper resistance or a breakout above resistance, they will have a large impact on the market’s movement. Source Brandon Bischoff
The Week Ahead
A potential fiery week lies ahead with central bank decisions in the U.S., Europe, and Australia, along with the latest U.S. employment data. For the FOMC, even though the bond market continues to sound recession alarms, recent economic data like the S&P Global Flash PMIs suggests a resurgence in demand, and inflation and the labor market are not slowing nearly quickly enough to warrant a policy pivot.
On Wednesday, Chair Powell is likely to keep his options open after a quarter-point raise and reiterate no rate cuts for this year. In Europe, whether the ECB hikes by 25 or 50bps on Thursday may hinge on Tuesday’s CPI report, where a modest deceleration is expected. Australia’s central bank is anticipated to hold rates steady on Tuesday after a tamer inflation report last week. Back in the U.S., it’s also time for labor market updates, with JOLTS job openings on Tuesday, ADP private payrolls on Wednesday, and the government’s monthly release on Friday. April’s non-farm payrolls are expected to be lighter versus the prior month but to still expand by 180K. Other U.S. events of note include ISM PMIs, factory orders, Q1 unit labor costs, and consumer credit. Overseas, China’s April PMIs were due to be released over the weekend, while EU retail sales and Germany’s factory orders round out the international docket.
This article is provided by Gene Witt of FourStar Wealth Advisors, LLC (“FourStar” or the “Firm”) for general informational purposes only. This information is not considered to be an offer to buy or sell any securities or investments. Investing involves the risk of loss and investors should be prepared to bear potential losses. Investments should only be made after thorough review with your investment advisor, considering all factors including personal goals, needs and risk tolerance. FourStar is a SEC registered investment adviser that maintains a principal place of business in the State of Illinois. The Firm may only transact business in those states in which it is notice filed or qualifies for a corresponding exemption from such requirements. For information about FourStar’s registration status and business operations, please consult the Firm’s Form ADV disclosure documents, the most recent versions of which are available on the SEC’s Investment Adviser Public Disclosure website at www.adviserinfo.sec.gov/
The Optimized Investor
