
The Economy &
Weekly Market Review for April 14th, 2023

The content of this Newsletter is to provide you with Economic insights to assist you in making better decisions with your investments. Unlike many other financial periodicals we will not mention specific companies, unless it is relevant to an overall economic issue. We welcome your questions on economic concerns and will address in our newsletter. just email us at info@optfinancialstrategies.com #FinancialAdvisor,#investmentmanagement #wealthmanagement #financialplanning #retirementplanning #401kplans
Week In Review
Earning season has begun and banks displayed stronger than expected earnings, however milder than expected consumer and producer price data stalled some of the momentum. The DOW and the Russell 2000 had the largest movement last week both posting more than 1.0% returns with the Russell at +1.52% and the DOW with +1.2% the S&P 500 +.79% and the NASDAQ pulled up the rear with +.29%
While gold was down for the week -.30% it reach an all-time high last week of $2060.2 last Thursday as the dollar continued to weaken.
Last week’s market increase came as Q1 earnings from big banks including JPMorgan Chase (JPM), Citigroup (C) and Wells Fargo (WFC) surpassed estimates on Friday.
A day earlier, data showed the US producer price index fell 0.5% last month, marking an unexpected drop as the consensus was for the index to remain unchanged in March following a flat reading for February. The PPI advanced 2.7% annually, the smallest gain since January 2021.
On Wednesday, a separate report showed the US seasonally adjusted consumer price index, another key measure of inflation, rose by 0.1% in March; this was smaller than the 0.2% increase that was expected and smaller than February's 0.4% gain. In addition, the year-over-year rate for overall CPI slowed to 5% from 6% in the previous month, marking the smallest gain since May 2021.
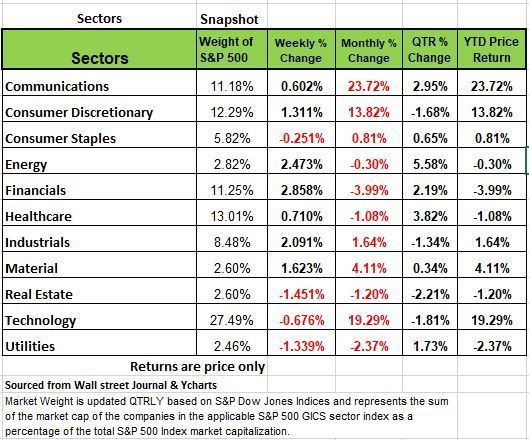
The week's advance was led by a 2.9% climb in materials, a 2.5% rise in energy and a 2.1% increase in industrials. Other gainers included materials, consumer discretionary, health care and communication services.
Real estate led to the downside with a 1.5% drop, followed by a 1.3% decline. Technology and consumer staples also edged lower.
Next week's earnings calendar features companies such as Charles Schwab (SCHW), Johnson & Johnson (JNJ), Bank of America (BAC), Netflix (NFLX), Goldman Sachs Group (GS), United Airlines (UAL), Tesla (TSLA), Abbott Laboratories (ABT), International Business Machines (IBM), Philip Morris International (PM), AT&T (T), Union Pacific (UNP), American Express (AXP) and Procter & Gamble (PG).
Economic data will feature several housing reports next week, including the NAHB/Wells Fargo Housing Market index for April on Monday, March housing starts on Tuesday, and March existing home sales on Thursday.
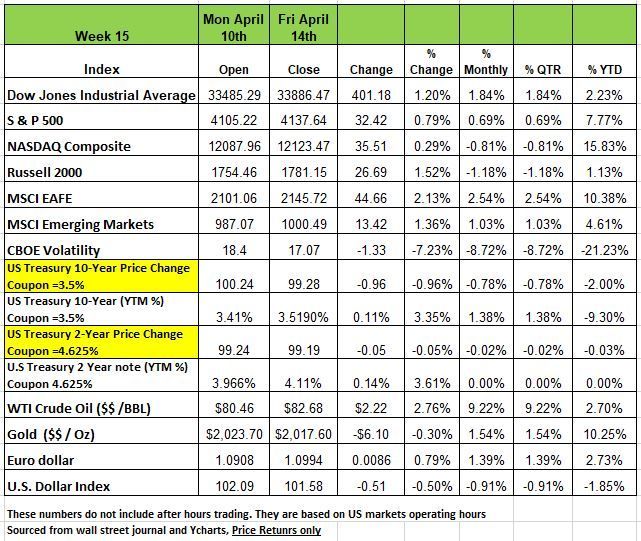
U.S. Treasury Bond yields were mostly up across the yield curve last week as investors reacted to Federal Reserve March meeting minutes and inflation data. Minutes from the Federal Reserve’s March policy meeting revealed that many Fed officials think the stress on the banking system will lower the peak rate needed to combat inflation. Investors digested a slew of inflation data on Wednesday and Thursday. The Consumer Price Index, or CPI, rose 0.1% in March, below the expected 0.2%. The CPI is up 5.0% year-over-year. The “core” CPI, which excludes the volatility of energy and food prices, is 5.6% year-over-year. The “core” CPI came in-line with expectations. The Producer Price Index, or PPI, declined 0.5% in March, which was well below the expectation of no change. Like CPI, the reason for the lower PPI print was related to energy prices pulling back in March. The stronger “core” CPI and the underlying dynamics of the PPI indicate that inflation is sticky, and still a problem for the U.S. economy.
The Economy Good and Not so Good News
Forecasting economic conditions is a lot different today than it was 20 years ago. There are a number of reasons why things have changed. For one, it has been more than 100 years since the world experienced a global pandemic. In addition, we have never been in a position where the U.S. government had infused massive amounts of money into the system over a 2-year period including the transfer of payments to so many people, then reverse course to quickly reduce the money supply while rapidly increasing interest rates to combat inflation. It is unprecedented and as most academics will tell you they tend to look at the past to try to predict future events. But there is also another variable that has changed and that is the consumer. Attitudes are different, the pandemic has also impacted the consumers attitude about work and priorities.
The US economy seems to have conflicting economic issues right now and is being tugged in two different directions. On the positive side we have low unemployment, we still have the lingering effects of the massive stimulus, the renormalization of after COVID Lockdowns, and, as always, the entrepreneurial and innovative spirit of the American people.
On the downside we have the early stages of a drop in the money supply increase cost of money which has reduced capex, a lower participation rate in the labor force, inflation seems to be a little more sticky than we expected, too much government spending which will hurt out dollar and lastly a global political tensions
The question now becomes whether or not the imbalance balance of these forces pushes the US economy into a recession. We saw a surge in consumer spending in January, Real GDP growth remained positive in the first quarter. January came in strong due to odd factors like unusually warm weather, a big Social Security cost-of-living adjustments and enough consumer spending to maybe deflect the headwinds.
We think the economy may have grown at a 2.3% annual rate in Q1, but more incoming data may lead to an adjustment of this number. We think the second quarter may be weaker than Q1. The ISM Manufacturing index has been below 50 for five straight months and, at 46.3, is at a level often (although not always) associated with a recession. Manufacturing production is down 1.1% from a year ago. The ISM Services index is barely north of 50. Continuing unemployment claims are up 37% from six months ago. Retail sales are down in four of the past five months, the lone exception being the January surge. But some states are still offering healthy unemployment benefits which is delaying the return to the workforce for some. We have seen large layoffs in the tech sector and with that is also some very generous severance packages, but we are unsure when and if those unemployment numbers will hit the system. Below is some of the rationale behind our thoughts.
Consumption: “Real” (inflation-adjusted) retail sales outside the auto sector grew at a 1.7% annual rate in Q1 while sales of autos and light trucks surged at a 29% rate and it looks like real services, which makes up most of consumer spending, should be up at a moderate pace. While we think much of the retail was up because of sales on excess inventory, we do not think it will keep that pace in Q2. Putting it all together, we estimate that real consumer spending on goods and services, combined, increased at a robust 4.3% rate, adding 2.9 points to the real GDP growth rate (4.3 times the consumption share of GDP, which is 68%, equals 2.9).
Business Investment: We think we will see a 5.1% growth rate for business investment, with gains in intellectual property and commercial construction leading the way. (Commercial construction may be driven by redesigning lower level Class B and C building since they seem to have the highest vacancy rates A 5.1% growth rate would add 0.7 points to real GDP growth. (5.1 times the 13% business investment share of GDP equals 0.7).
Home Building: Residential construction is still absorbing the pain of higher mortgage rates and looks like it fell at a 13.0% rate, which would subtract 0.5 points from real GDP growth. (-13.0 times the 4% residential construction share of GDP equals -0.5). There was an increase in new permits in Q1 but not construction starts we think the national contractors with cash on the side are building spec homes first
Government: Only direct government purchases of goods and services (not transfer payments) count when calculating GDP. We estimate these purchases – which represent a 18% share of GDP – were up at a 1.7% rate in Q1, which would add 0.3 points to the GDP growth rate (1.7 times the 18% government purchase share of GDP equals 0.3).
Trade: Looks like the trade deficit expanded in Q1, as imports rose faster than exports, thanks to re-opening in China and better growth in Europe than many expected. We’re projecting net exports will subtract 0.4 points from real GDP growth.
Inventories: Inventories look like they grew slower in Q1 than in Q4, suggesting a subtraction of about 0.7 points to the growth rate of real GDP. Look for continued slower inventories in 2023, which could be a significant drag on economic growth later this year.
Add it all up, and we get a 2.3% annual real GDP growth rate for the first quarter, juiced by a temporary spike in consumer spending in January that is unlikely to be repeated. Source Brian Westbury
A Technical Perspective
For those new readers to our newsletter technical analysis is an investment strategy /trading discipline that relies on identifying opportunities by analyzing statistical trends gathered from trading activity, such as price movement and volume. While no one can identify the bottom and peak price of a security, technical analysis tries to identify opportunities close to it.
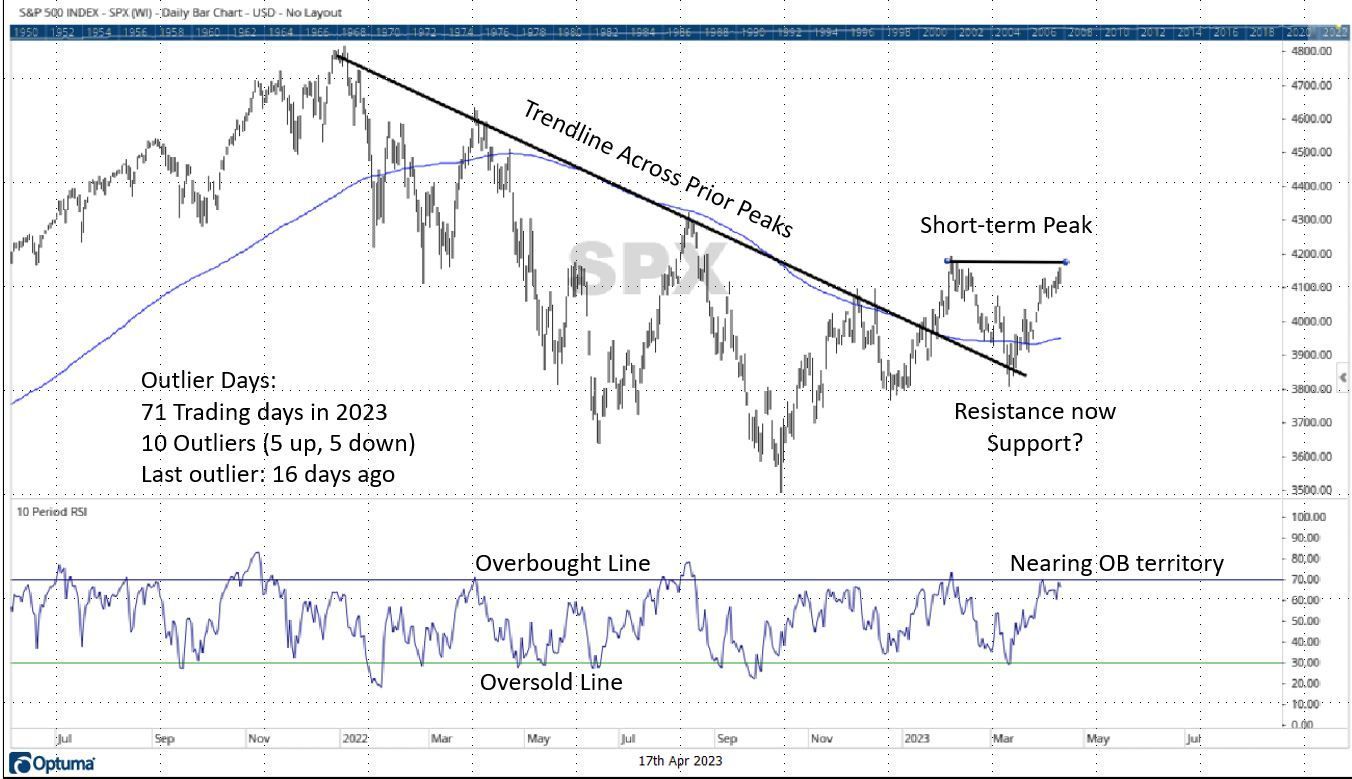
In the short term, the S&P 500 looks to be at a small point of resistance, while being nearly overbought. While it is positive that volatility has declined and outlier days have become less frequent, this could be a spot where you see a small burst in volatility in the form of one or more outlier days.
As a reminder, an outlier day is any single trading day that is beyond +/-1.50%. Outlier days are an indication of market efficiency. Typically, in a normal “rational” market, the S&P 500 would be expected to experience about 13 outlier days in a calendar year. Bear markets, or irrational and inefficient markets will experience a larger amount of outlier days. Last year as an example. 2022 was a bear market, the S&P 500 experienced 75 outlier days, which is about one outlier every three trading days—far more than what would be expected during any rational market environment.
So far in 2023, there have been 10 outlier days, which is still quite a few, but the frequency is nonetheless declining. The market’s last outlier day occurred 16 trading days ago. To put that into context, the longest stretch between outlier days in 2022 was only 11 trading days. This current stretch without an outlier day is the second longest so far this year (20 trading days is this year’s high-water mark). The decline in the frequency of outlier days is a positive for the market that coincides with declining volatility.
It would make sense that the market could experience another outlier day soon, either up or down. Short-term volatility is now the lowest it has been since November 2021. Declining volatility can be like the squeezing of a spring, in that you may eventually experience a release of pent-up pressure in the form of an outlier day.
For the longer term, the market has rallied off of prior resistance see chart below (the diagonal line drawn from prior peaks) and appears to have put in a higher low. So, the market is not declining as much as last year, a sign that the markets are rebounding. This is a crucial part of the process for returning to the market’s all-time high. Keep in mind that recoveries happen slowly so the recovery from last year’s bear market will take a little time.
Here are some additional comments regarding the S&P 500:
Point 1 shows a diagonal trend line across the market’s relative peaks in 2022. You can see that this line often behaved as “resistance,” meaning that when price rallied to this trend line, a wave of supply came in and pushed the market lower. We saw the S&P 500 break above this resistance line at the beginning of the year. You can also see that the market then declined to the trend line last month but bounced off it. This is a positive for the market. Has prior resistance now become support?
2. Right now, the S&P 500 is near a prior peak, which can be a point of contention. While the market index has appeared to have established a higher low, can it also put in a higher high? Sometimes, you may experience an outlier day that bounces off, or even breaks through the resistance line.
3. Coinciding with the prior peak, the S&P 500 is very close to being “overbought” meaning its risen too far, too fast according to its 10-period RSI (a common technical indicator). When a market or security becomes overbought, it would be expected to experience some sort of pullback or sideways movement to catch its breath.
In summary, in the short term, the market is almost overbought, and near its recent peak, which could behave as resistance. In addition, volatility is declining with 10-day Volatility Index at its lowest point for the last year and a half. This could be a recipe for another outlier day, as the market has not seen one in a few weeks. Keep in mind that the outlier day can come in either direction, up or down. Source Brandon Bischoff
The Week Ahead
Earnings season heats up in earnest for U.S. corporations this week, while the international agenda focuses on China’s potential growth rebound and global business surveys. Later tonight, China is expected to report 1.2% growth from the prior quarter, while retail sales may jump significantly given the lifting of Covid-19 restrictions. Global flash PMIs arrive Friday and investors will be keying in on whether price pressures are receding and to what extent recessionary clues emerge. Wednesday’s UK March CPI is expected to remain stubbornly high, which could all but cement another interest rate hike at the May central bank meeting. The domestic schedule includes regional manufacturing surveys from New York and Philadelphia, housing starts, and existing home sales. First quarter earnings updates are due from Netflix, Tesla, Goldman Sachs, Zions Bancorp, and American Express, among others. Lastly, Canada’s inflation numbers and Eurozone sentiment reports round out the week’s economic calendar.
This article is provided by Gene Witt of FourStar Wealth Advisors, LLC (“FourStar” or the “Firm”) for general informational purposes only. This information is not considered to be an offer to buy or sell any securities or investments. Investing involves the risk of loss and investors should be prepared to bear potential losses. Investments should only be made after thorough review with your investment advisor, considering all factors including personal goals, needs and risk tolerance. FourStar is a SEC registered investment adviser that maintains a principal place of business in the State of Illinois. The Firm may only transact business in those states in which it is notice filed or qualifies for a corresponding exemption from such requirements. For information about FourStar’s registration status and business operations, please consult the Firm’s Form ADV disclosure documents, the most recent versions of which are available on the SEC’s Investment Adviser Public Disclosure website at www.adviserinfo.sec.gov/
The Optimized Investor
