
The Economy &
the Markets
for February 5th 2024

The content of this Newsletter is to provide you with Economic insights to assist you in making better decisions with your investments. Unlike many other financial periodicals we will not mention specific companies, unless it is relevant to an overall economic issue. We welcome your questions on economic concerns and will address in our newsletter. just email us at info@optfinancialstrategies.com #FinancialAdvisor,#investmentmanagement #wealthmanagement #financialplanning #retirementplanning #401kplans
Week In Review
Last week marked the end on the first month of trading in 2024. Three of the four major indices posted a positive return for January with the S&P posting a +1.59% return followed by the DOW +1.22% and the NASDAQ +1.02%. The Russell 2000 ended the month of January down -3.93%.
However the week ended much higher the S&P 500 closed last week at all-time highs. Equity market headlines were littered with large U.S. names announcing quarterly results. Microsoft Corp. announced quarterly results with earnings besting estimates by 5% and revenue by 1%. Despite the beats there are some worries on their cloud business growth, but management assured the street Azure growth remained stable, all told shares rallied 1.8% last week.
Apple Inc. announced quarterly results that also were not well received by investors. The hardware giant continues its struggle in China, where revenues were $20.8b for 4Q falling below $23.5b expectations. Also missing expectations were wearable’s, iPads and Mac’s revenues. Top line revenue still bested expectations carried by iPhone revenues. Overall, their shares sank 3.4% last week as concerns from their China business and their overall iPhone refresh cycle remain an overhang for investors.
Facebook and Instagram parent Meta Inc. had a blockbuster earnings announcement which added $197b to its market cap after shares rallied 20.5% last week. Meta announced earnings and revenue well above analyst expectations and they announced next quarter guidance ahead of expectations as well. They announced a $50b buyback and initiated a dividend of $0.50 per share putting to bed any lingering apprehension on when, and how much, cash they planned to return shareholders
Treasury yields finished the week mixed, as shorter duration yields ended higher while longer duration yields fell. The focus was on Jerome Powell and the Federal Reserve as the first FOMC meeting of the new year took place last Wednesday. The Fed didn’t change short-term interest rates, nor did it alter the pace of Quantitative Tightening, though Fed Chair Jerome Powell had a more confident tune during his press conference. He stated that incoming data has been in-line with what the Fed wants to see to start the rate cut process and that there isn’t a reason to expect the positive progression of inflation data to shift in the months ahead. In addition, the Fed chair made an appearance on 60 minutes on Sunday night, which was taped in advance of the broadcast reiterated that rates are going to stay where they are until the Fed has more confidence that inflation will not bounce back up. Markets seem to be responding to that on Monday as of this writing
The ISM Manufacturing Index increased to 49.1 in January, beating the consensus expected 47.2. Activity in the US manufacturing sector contracted for the fifteenth consecutive month in January, but the details of the report show some signs of improvement. Nonfarm productivity increased 3.2% at an annual rate in the fourth quarter, beating the consensus expected gain of 2.5%. Both output and hours rose, but output rose at a faster pace, leading to more output per hour. Nonfarm payrolls increased 353,000 in January, beating the consensus expected 185,000. Payroll gains for November and December were revises up by a total of 126,000, bringing the net gain, including revisions, to 479,000

By Sector
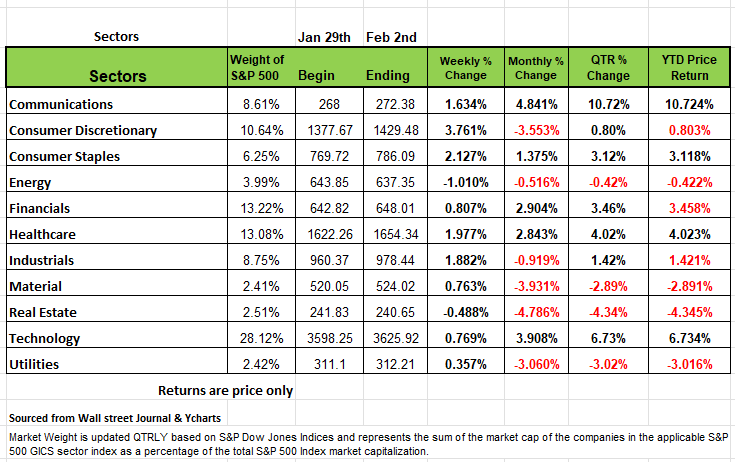
The consumer sectors had the largest percentage increases of the week, with consumer discretionary climbing 3.8% and consumer staples up 2.1%. Health care climbed 2.0%, industrials added 1.9% and communication services rose 1.6%. Other gainers included financials, technology, materials and utilities.
The gainers in consumer discretionary included General Motors (GM), which reported stronger-than-expected Q4 results despite impacts from the United Auto Workers strike and forecast 2024 earnings above views. Shares rose 11% on the week.
Shares of fellow auto maker Ford Motor (F) were also strong this week, climbing 6.6%, as the company reported higher US vehicle sales for January on an annual basis despite lower electric vehicle sales. Ford plans to release its Q4 results after the market close next Tuesday, Feb. 6.
In consumer staples, shares of Sysco (SYY) rose 8.4% as the provider of food products for the foodservice and hospitality industries reported fiscal Q2 adjusted earnings per share above analysts' expectations and reiterated its guidance for fiscal 2024.
Just two sectors ended the week in the red: Real estate shed 0.5% and energy declined 1.0%. The drop in energy came as crude oil futures fell.
The real estate sector's decliners included shares of Boston Properties (BXP), which fell 11% on the week. The real estate investment trust reported Q4 funds from operations and revenue came in slightly above analysts' mean estimates but much of its guidance range for 2024 funds from operations fell below the Street's then view.
Economic Issues
The markets were all but certain that the Federal Reserve would have cut interest rates by its May meeting, that is until last week's blowout jobs numbers. During last week’s press conference Powell let the markets know March was highly unlikely of a cut so the - the question was whether that first reduction would come in March, or at the May meeting itself. The Markets were betting on a May cut, then Fridays job numbers came out and now even a May rate cut is less certain. The current market pricing reflects roughly a 30% chance the Fed will still be holding rates at its current level after that meeting, down from around 10% a week ago, and less than 5% at the start of the year, this according to CME's FedWatch tool.
Changes in those expectations are likely to be the main driver of day-to-day market swings in the coming weeks, just as markets' daily churn during the first month of 2024 was all about whether or not rate cuts would come in March.
The driver of the shift from March to May was Friday's data that showed nonfarm payrolls increased by 353,000 jobs last month, the largest gain in a year, and far higher than the 18,000 average of economists polled. Crazy strong jobs number means Fed will wait mainly because inflation may spike, more jobs with higher income will means more demand on goods, especially on housing which has a weight of 33% in the calculation of inflation.
However, those job number are not exactly as rosy as everyone thinks. First, the same payroll survey showing strong job growth is showing a concerning drop in the number of hours per worker. Workers in the private sector worked an average of 34.6 hours per week in January 2023; this January they were down to 34.1. It may not sound like a lot but the average weekly hours haven’t been this low since March 2020, with the onset of COVID. So, even though total jobs are up 1.9% in the past year, total hours worked are up only 0.3%. To put this in perspective, a 0.3% increase in private-sector jobs in the past year would have meant private payroll gains of 33,000 per month, not the 194,000 per month we experienced. (A 0.3% gain in jobs is what would have happened if businesses had hired workers to fill the extra hours they needed, but kept the number of hours per worker the same.) Business still do not have the demand to provide more hours for workers, so while more people are working, it’s at a shorter work week.
The other component here is the household survey, (another measure of employment) hasn’t been rising nearly as fast as payrolls, which is something that has historically occurred prior to a recession. Nonfarm payrolls (which includes government workers) are up 244,000 per month in the past year. But the household survey (smoothed for recent population adjustments) is up only 101,000 per month in the past year. That’s a very large gap.
Another issue that concerns us is having payroll growth of 244,000 per month over the past year while the unemployment rate has been so low. So, while we understand that people are constantly exiting and enter the labor market. It just seems a bit odd that the unemployment rate is not moving up to enough to justify the job increases.
If we go back in history, since February 2001, right before the 2001 recession, payrolls had grown at an average pace of 91,000 per month. Since February 2020, right before COVID, payrolls have grown at an average pace of 115,000 per month. Those longer-term averages make sense given a growing population in the context of an aging workforce. But what does not make sense is how we can have payroll growth so much faster in the past year, when the unemployment rate is already so low? Job growth would get slower when the jobless rate is near bottom as it is now.
Some economist theorize that this can be explain because the US economy has been temporarily boosted by having the government run a larger budget deficit, including the effects of the CHIPS Act, infrastructure bill, and the Inflation Reduction Act. But this artificial boost should soon come to an end. And when it does job growth would come to a halt.
A strong job market is a good thing, but it doesn’t mean a recession will not start sometime in the near future. Payrolls are up 1.9% in the past year. But they were up the same in the year ending in January 1990 and a recession started mid-year. They were up 1.3% in the year ending January 2001 and a recession started in Spring 2001. To use an analogy the flu starts when you’re feeling good and then it often knocks you off your feet. So, it’s typical for a recession, like the flu, to come when the economy looks fine.
We know we have been more cautious since the pandemic started and some may feel that by being overly cautious, they have missed out on some growth, but know when markets go to one extreme they often go to the other, and you should be comfortable with the risk of a correction especially if you are in or close to retirement a market decline when you’re pulling out 5% or more may not allow you to get back on track so easily. Source Economist Brian Westbury
.
A Technical Perspective
Technical analysis is an investment strategy /trading discipline that relies on identifying opportunities by analyzing statistical trends gathered from trading activity, such as price movement and volume. While no one can identify the bottom and peak price of a security, technical analysis tries to identify opportunities close to it.
Mega Caps Are Carrying the Market
Friday was a very interesting day for the markets. The S&P 500 finished the day up +1.07%. On the surface, that would seem pretty good. But, if you look at how the components of the market performed, things become a bit murkier.
The 1.07% move is misleading because of the performance of three mega cap “Magnificent 7” stocks. After reporting earnings, META’s stock was up more than +20% and Amazon was up +7%. Nvidia was up nearly +5%. In looking at their stock price prior to the move, that is a huge increase
Keep in mind that the S&P 500 is capitalization-weighted index, meaning larger securities, like the ones that make up the Magnificent 7, have a greater impact on the index’s movements. While the index was up +1%, the equal weight S&P 500 was actually down -0.09% (meaning that the average stock was down for the day). The table below, provided by us, shows how the average stock from each S&P 500 sector performed on Friday Feb 2nd.
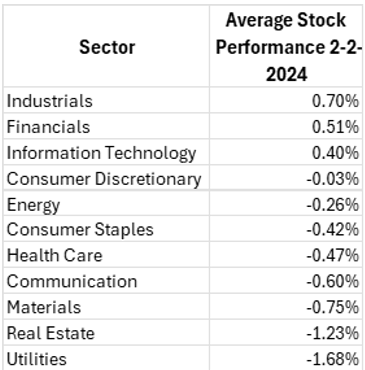
Only three S&P 500 sectors had stocks that were up on average at Friday’s close. As a matter of fact, more than half of the S&P 500’s stocks were down on Friday. Most of the market’s trading volume (conviction) was actually to the downside. So, in order for the market to be up +1.07% on Friday, a few large stocks had to do most of the heavy lifting.
A Broader Picture of the Market
The S&P 500 has low volatility right now. So far this year, there has only been one “outlier day” (a trading day beyond +/-1.50%). Generally speaking, low volatility is a bull market characteristic.
That does not mean that the markets are without issues. Only two sectors are beating the S&P 500 in the early days of 2024. The Information Technology and Communications sectors continue their outperformance from 2023. These two sectors combine for nearly 40% of the S&P 500’s market capitalization. While the S&P 500 is making new highs, the average stock is still -10% off its 1-year high. The Russell 2000 index, which measures smaller capitalized companies, is 20% off its 2021 peak.
Chart of the week- Russell 2000
That brings us to our chart of the week- the Russell 2000. The Russell 2000 measures smaller capitalized companies. Traditionally speaking, small cap stocks have been viewed as “high risk, high reward.” Lately, they have leaned towards the “high risk” side of the equation.
A chart of a Russell 2000 ETF and is accompanied by some technical notes.
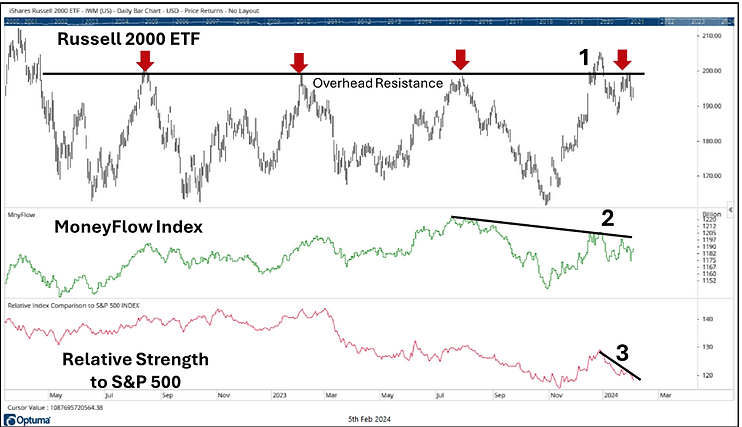
You can see that there is a horizontal “resistance” line drawn across the Russell 2000’s peaks. These are the points where supply and demand shift. Each peak has occurred around the same price level. At these peaks, supply has tended to take over and cause a “selloff.” Recently, the index briefly broke above this resistance line, but then failed when it attempted to test it for “support.” It then rallied back to it and bounced down off of it. This is a major resistance level.
Directly below the Russell 2000 price chart is its MoneyFlow Index. MoneyFlow is a volume-based indicator, and often referred to as a “smart money index.” At the Russell 2000’s most recent peak, you can see that the MoneyFlow index put in a lower high than the previous peak, even though the index’s price was actually slightly higher. This is called a “negative divergence” and means that the most recent rally occurred on lower volume, indicating lower conviction in the move.
The bottom portion of the chart shows the index’s relative strength to the S&P 500. A descending trend in relative strength indicates that the Russell 2000 is underperforming or has been weaker than the S&P 500 index.
The large market indexes, like the S&P 500, have low volatility. This is a bull market characteristic but is mostly due to the index’s large exposure to the best performing asset class: technology. The recent market movement has been less apparent of a rising tide lifting all ships. So basically, the bigger boats rise while smaller ones are just treading water.
Nonetheless, there are stocks and securities that are doing well. From a portfolio management perspective, holding sector ETFs in both Information Technology and Communications are producing excellent returns right now.
Looking at risk management, bonds have not done well recently. If interest rates fall, bond prices will be expected to rise. Some experts are saying that inflation is not done rising, so falling rates are not necessarily a done deal. That being said, a portfolio of securities needs risk management. While one’s portfolio has several stock and equity positions, you should also hold a few inverse securities, which move in the opposite direction of their underlying index and are held to provide some risk management, in case there is a market correction. Source Brandon Bischoff, Canterbury
The Week Ahead
Equity and interest rate volatility may persist as investors continue processing the data deluge released last week. In the meantime, this week’s economic calendar is much lighter, with mostly second-tier releases and the tail end of U.S. earnings season. Now that the Fed’s quiet period has elapsed, FOMC members will resume public appearances this week, perhaps providing some indications of their individual viewpoints regarding interest rate cuts. The 10- and 30-year Treasury auctions on Wednesday and Thursday will be closely monitored after the recent bond market instability. Today’s ISM Services PMI may reveal a similar bump in price pressures that were evident in the manufacturing sector survey. Earnings announcements of note throughout the week include companies like Caterpillar, McDonald’s, British Petroleum, Disney, PayPal, Uber, and ConocoPhillips.
Wednesday’s trade balance and consumer credit figures round out the domestic agenda. Overseas, the Reserve Bank of Australia releases its rate statement later tonight. Last week’s CPI reading came in lower than expected, which will likely prompt discussion of when the RBA might start easing policy. In Europe, updates on Germany’s beleaguered manufacturing sector arrive with factory orders and industrial production figures. Finally, China’s inflation numbers will be released late Wednesday, as the economy undergoes deflation even as the government attempts to stimulate growth.
This article is provided by Gene Witt of FourStar Wealth Advisors, LLC (“FourStar” or the “Firm”) for general informational purposes only. This information is not considered to be an offer to buy or sell any securities or investments. Investing involves the risk of loss and investors should be prepared to bear potential losses. Investments should only be made after thorough review with your investment advisor, considering all factors including personal goals, needs and risk tolerance. FourStar is a SEC registered investment adviser that maintains a principal place of business in the State of Illinois. The Firm may only transact business in those states in which it is notice filed or qualifies for a corresponding exemption from such requirements. For information about FourStar’s registration status and business operations, please consult the Firm’s Form ADV disclosure documents, the most recent versions of which are available on the SEC’s Investment Adviser Public Disclosure website at www.adviserinfo.sec.gov/
The Optimized Investor
