
Is this time different?
a Weekly Market Review
for February 12th 2024

The content of this Newsletter is to provide you with Economic insights to assist you in making better decisions with your investments. Unlike many other financial periodicals we will not mention specific companies, unless it is relevant to an overall economic issue. We welcome your questions on economic concerns and will address in our newsletter. just email us at info@optfinancialstrategies.com #FinancialAdvisor,#investmentmanagement #wealthmanagement #financialplanning #retirementplanning #401kplans
Week In Review
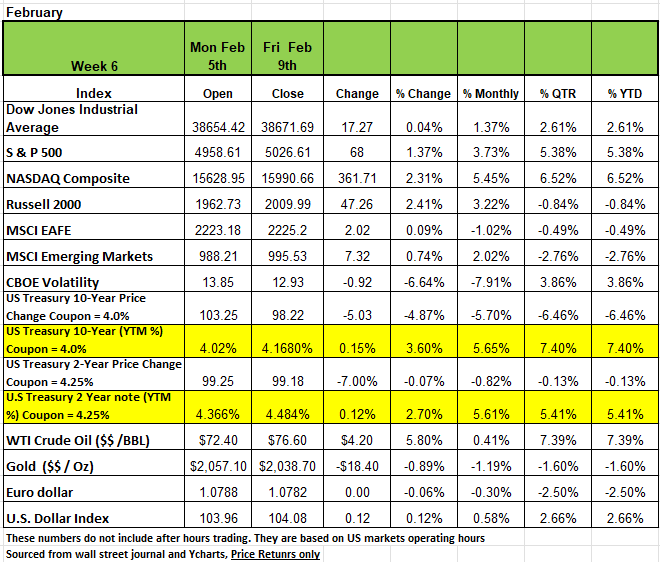
All four of the major indices posted positive returns last week with the Russell 2000 returning +2.41% followed by the NASDAQ +2.31% the S&P500 +1.37% and the DOW+0.04% The big excitement was that the S&P 500 index closed above the 5,000 level for the first time to a fresh record, as a round of better-than-expected quarterly results boosted investor sentiment. The market benchmark ended the week at 5,026.61 and hit a fresh intraday high on Friday at 5,030.06. The S&P 500 has risen for five straight weeks and is now up 5.4% in 2024. The latest round of quarterly earnings came in mostly above analysts' expectations as 69% of the S&P 500's components topped forecasts. Companies that had large surprises to the upside included Illumina (ILMN), Uber Technologies (UBER) and Ford Motor (F).
Treasury yields finished higher across the board last week after a batch of strong economic data supported the notion that the Fed will take a cautious approach with interest rate cuts as he had stated on his 60 minutes interview. Last Monday, the ISM Non-Manufacturing index rose to 53.4 in January, beating the consensus expected of 52.0 and signaling no signs of recession in the service sector. All the major measures of activity were mostly higher in January. The trade deficit in goods came in slightly larger than expected on Wednesday. Exports were led by nonmonetary gold, other petroleum products, and crude oil while imports were led by pharmaceuticals and cellphones & other household goods. Initial jobless claims declined from a three-month high on Thursday, falling by 9,000 to 218,000 last week. Jobless claims continue to remain extremely low as businesses have been reluctant to lay off workers because of a tight and steadily growing economy. Treasury yields continued to trade higher, with the 2-year reaching its highest since mid-December, as the CPI revisions gave new life to investors' optimistic views on the U.S. economy. Oil prices rose last week on the back of diminishing prospects for a de-escalation in the Middle East. WTI and Brent crude ended last week higher at $76.60 and $82.19/bbl, respectively, as a slowdown in US crude production put an ease to worries of potential oversupply in the market. Meanwhile, gold ended the week slightly lower at $2038.70 troy/oz.
Economic data anticipated this week include the January consumer price index on Tuesday and the January producer price index on Friday. Other reports will include January retail sales and industrial production on Thursday and January housing starts and building permits on Friday. All eye will be on the CPI number as most are expecting inflation to hold steady, any variation from the month over month number will most likely move the markets. A lower reading will give investors’ confidence that the Fed will cut sooner and a higher reading will be the opposite.
By Sector
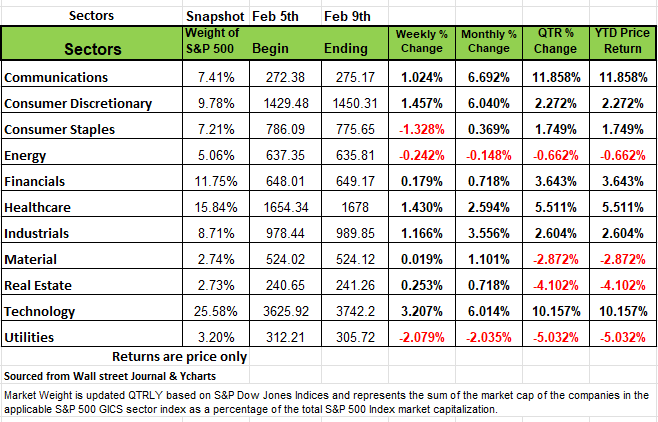
The technology sector had the largest percentage increase of the week, up 3.2%, followed by a 1.5% rise in consumer discretionary, a 1.4% increase in health care and a 1.2% rise in industrials. Other gainers included communication services, real estate, financials and materials. The technology sector's gainers included shares of Monolithic Power Systems (MPWR), which jumped 18% on the week as the semiconductor-based power electronics company reported Q4 results above analysts' expectations. The company also forecast Q1 revenue above Street views at the time and boosted its quarterly dividend rate.
In consumer discretionary, shares of Ralph Lauren (RL) climbed 18% as the luxury lifestyle products company fiscal Q3 results came in ahead of analysts' forecasts. The company also raised its guidance for fiscal 2024 revenue growth to the top end of its prior guidance range.
Eli Lilly (LLY) shares led the health care sector's advance. The company said it has a sense of "urgency" to bolster manufacturing capacity to meet demand for weight loss and diabetes drugs after Zepbound and Mounjaro helped its Q4 revenue trounce Wall Street's expectations. Shares rose 11%.
Three sectors fell: utilities shed -2.1%, consumer staples declined -1.3% and energy edged down -0.2%.
The utilities sector's decliners included shares of Duke Energy (DUK), which fell 4.7%. The company's Q4 adjusted earnings per share missed the Street view despite operating revenue coming in slightly above expectations.
This week's earnings calendar features Arista Networks (ANET), Waste Management (MW), Coca-Cola (KO), Shopify (SHOP), Airbnb (ABNB), Cisco Systems (CSCO), Kraft Heinz (KHC), Applied Materials (AMAT), Deere (DE), Southern Co. (SO) and DoorDash (DASH).
Is this time Different?
The S&P 500 breached the 5000 level on Friday closing at 5,026.61. Now bullish investors are drooling over the next significant milestone for the market benchmark S&P Index 5000. However, for the not so season investor one should realize that these milestones have a gravitational pull as investors become fixated on making more money and hitting these milestones. These milestones have very little meaning other than being psychological markers if you’re in the media. What are they trying to convey? That you need to be in the market now? Perhaps those that have been cautious or more conservative with holding in fixed income will second guess themselves for Fearing of Missing out and jump in late in the game often leading to disappointment.
The recent threshold should be looked at a little closer
Just a few months ago, on October 27th, the market was down -10.28% from its peak of 4588.96 on July 31st. Investors were very negative about the markets, rising interest rates, a potential recession and 2022 market performance still fresh in their minds. However, over the last 71 trading days the S&P 500 has returned more than 22.08% as of Friday’s close. The Bullish sentiment seems to be pushing markets higher.
This leads us back to Bob Farrell and his 10 rules for investing. For now, we will just focus on rules number 2.
Excesses in one direction will lead to an opposite excess in the other direction.
Translation: Markets that overshoot on the upside will also overshoot on the downside, kind of like a pendulum. The further it swings to one side, the further it corrects to the other side.
Currently the S&P is 12.6% above its 200-day moving average, which is more than 3 standard deviations of its mean. That is a significant number expecially since this movement occurred in such a short time period, 71 days. Over confidence can be a costly move in this environment, be careful, pay atention to the rest of the companies and their profitability
The history lesson here is that investors again believe we are in an unstoppable bull market. With the S&P index setting a historical record by hitting 5000, it seems nothing can derail the bulls. But such is always the sentiment just before it changes. The only question is, what causes the change in sentiment? Unfortunately, we will never know with certainty until after the fact. Some may think that only a Black Swan event that comes out of nowhere will impact the current conditions. But sometimes its just that we do not pay attention to the obvious.
We do know that the market currently has all the ingredients needed for a period of price correction. Retail and professional investor sentiment is at levels usually associated with short- to intermediate-term market peaks. The chart below marks when the investor sentiment ratio is above 2.5.
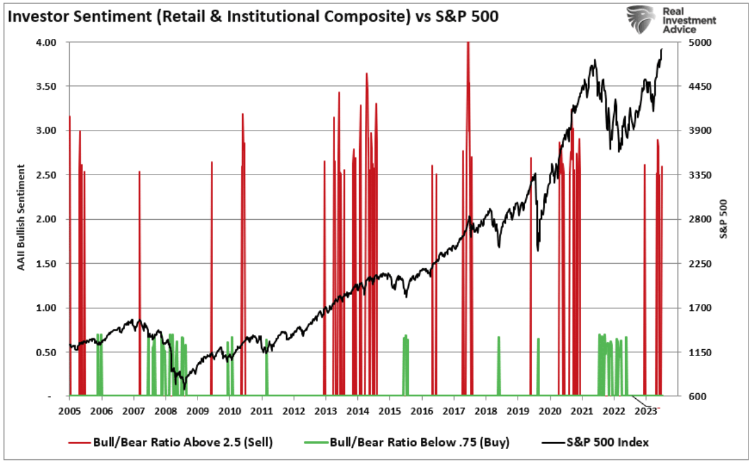
Those levels have previously marked short-term market peaks. Ratios below 0.75 have correlated with market bottoms.
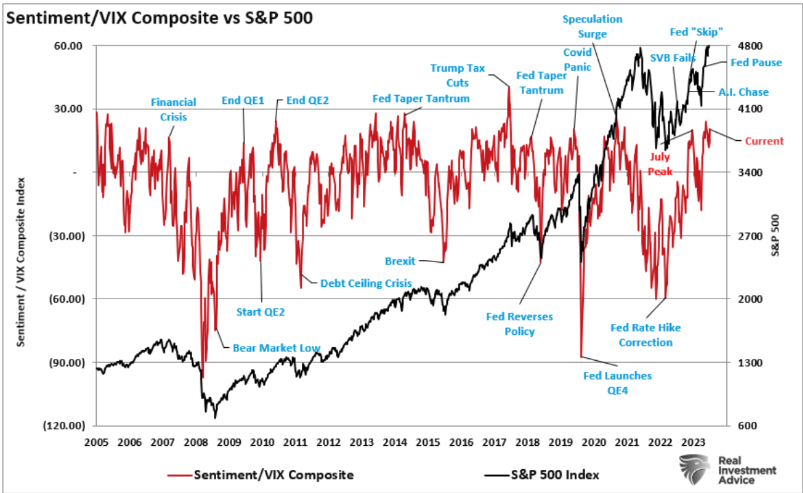
Another measure of bullish sentiment is comparing investor sentiment to the volatility index. Low levels of volatility exist when there is little concern about a market correction. Low volatility and bullish sentiment are often cozy roommates. The chart below compares the VIX/Sentiment ratio to the S&P Index. Once again, this measure suggests that markets are at risk of a short-term price correction.
Another interesting facet about the current market is that as the S&P Index approaches a psychological 5000 level, that advance continues to be a function of a relatively small number of stocks doing most of the lifting. As we discussed in previous new letters, given the weight of the top-10 “Market-Capitalization” companies in the S&P index, currently comprises 35% of the index movement.
While the S&P index is hitting “all-time” highs and hitting the “psychological” level of 5000, it remains a story of the “haves” and the “have nots.” While Mega-capitalization companies have earnings, and investors are bidding up the market in anticipation of future earnings growth, however, earnings are declining for everyone else.
With markets technically stretched, sentiment bullish, and still weak fundamental underpinnings, the index hitting 5000 as a measure of market health is a bit of a mirage. At some point, earnings for the broad market will need to accelerate, requiring more substantial economic growth rates, or a more meaningful correction will occur to realign valuations. Historically, it has been the latter.
Source Lance Roberts. https://www.advisorperspectives.com/commentaries/2024/02/12/s-p-index-hit-5000-bull-run-continues
The Week Ahead
This week, U.S. investors will focus on several inflation-related economic releases. The first is Tuesday’s January CPI report, and the second is Friday’s preliminary consumer sentiment reading for February that includes inflation expectations. With Fed officials pushing back recently on rate cut
prospects, these inflation updates will be critical data points. Friday’s producer price index will also be influential, albeit to a lesser extent. Thursday’s retail sales figures could reveal if inflation pressures forced consumers to pull back on spending as the new year began. For the manufacturing sector, surveys from the New York and Philadelphia regions will arrive on Thursday along with U.S. industrial production figures. Housing starts and building permits round out the domestic calendar on Friday. Overseas, various Asian markets will be closed for the Lunar New Year holidays at the start of the week. On Wednesday evening, Japan’s Q4 GDP is expected to return to growth after a steeper- than-expected contraction in Q3. The UK has January’s employment and wage data, CPI, and retail sales figures. Additionally, the GDP update will reveal whether the British economy suffered a second consecutive quarter of contraction at the end of 2023. Finally, in Europe, the second estimate for Q4 GDP and economic sentiment are the only items of note in a quiet week
This article is provided by Gene Witt of FourStar Wealth Advisors, LLC (“FourStar” or the “Firm”) for general informational purposes only. This information is not considered to be an offer to buy or sell any securities or investments. Investing involves the risk of loss and investors should be prepared to bear potential losses. Investments should only be made after thorough review with your investment advisor, considering all factors including personal goals, needs and risk tolerance. FourStar is a SEC registered investment adviser that maintains a principal place of business in the State of Illinois. The Firm may only transact business in those states in which it is notice filed or qualifies for a corresponding exemption from such requirements. For information about FourStar’s registration status and business operations, please consult the Firm’s Form ADV disclosure documents, the most recent versions of which are available on the SEC’s Investment Adviser Public Disclosure website at www.adviserinfo.sec.gov/
The Optimized Investor
