
The Economic Climate for the Week Ending
June 17th 2022

The content of this Newsletter is to provide you with Economic insights to assist you in making better decisions with your investments. Unlike many other financial periodicals we will not mention specific companies, unless it is relevant to an overall economic issue. We welcome your questions on economic concerns and will address in our newsletter. just email us at info@optfinancialstrategies.com #FinancialAdvisor,#investmentmanagement #wealthmanagement #financialplanning #retirementplanning #401kplans
The stock market got hammered again last week as investors realized how serious the economic situation has become with a Fed boxed into a corner from not acting appropriately months ago. The Bond market, however, appears to have come around to our view that the Recession will come sooner and be deeper than the media narrative would have us believe. If you take a look at the chart below you will see nothing but Red, every index is except the DOW, is in bear market territory and the NASDAQ is in deep. Last week’s drop ranged from -4.78% (NASDAQ) to -7.48% the Russell 2000. Last week FMOC press release Fed Chair Powell announce a .75% Fed rate interest rate hike. At first the markets responded positively and then torpedoed over the next two days. There doesn’t seem to be any place to hide in this environment. Even cash is eroded by inflation. But the smart investor is staying calm and will take advantage of opportunities as they emerge.
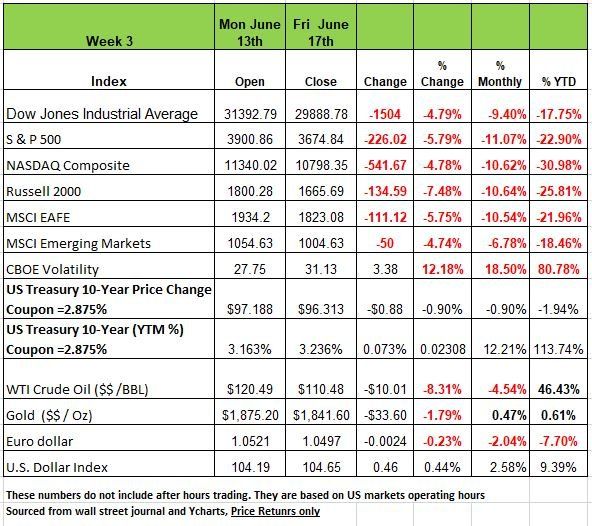
The headline event last week was the Federal Reserve Open Market Committee meeting in which the Fed delivered its largest rate increase 75 bps in 28 years. This was done in an effort to tame inflation running a lot higher than expected. Powell stated the committee is “strongly committed to returning inflation to its 2 percent objective.” Markets have very rapidly priced in higher rates amid elevated inflation readings. The aggressive move came despite signs that the economy is beginning to cool with retail sales contracting in May, and the National Association of Home Builders housing market index dropping to its lowest level in two years amid higher mortgage rates and diminished home affordability.
This week will include data on existing home sales, new home sales, the Chicago Fed index, and manufacturing and services PMIs for June. Additionally, Fed chair Jerome Powell will deliver his semi-annual monetary policy testimony before the House and Senate banking committees. Given the events of the past week, Powell will undoubtedly be grilled by Congress on his plans to navigate the economy to a soft-landing while at the same time driving down the highest inflation the country has seen in more than 40 years.
Inflation Basics
With all of the media talking about inflation we thought perhaps we might address the topic and try to explain some of the causes behind it. As Milton Friedman once stated “Inflation is always and everywhere a monetary phenomenon, in the sense that it is and can be produced only by a more rapid increase in the quantity of money than in output”
Basically, Inflation is an increase in prices, usually it is combined with low unemployment, high wages, rapid economic growth, and rising levels of credit. Inflation occurs when demand exceeds supply at current prices. This is the result of excessive spending by consumers financed by credit markets and bank loans or in the case of this bout the governments infusion of free money to the public. Keeping inflation low has long been a priority of the Federal Reserve.
Different situations can drive inflation below are a few causes:
Sustained inflation occurs when the overall price level continues to rise over a fairly long period of time. Most economists believe that sustained inflation can occur only if the Fed continuously increases the money supply.
Demand-pull inflation is initiated by an increase in aggregate demand. As demand shifts higher while supply remains the same, the equilibrium price will increase.
Cost-push or supply-side inflation is initiated by an increase in costs. An increase in costs may also lead to stagflation - when the economy is experiencing inflation during a time of contraction.
There is an expected inflation is "built into the system" as a result of expectations. If prices have been rising and people form their expectations from this past behavior, firms may continue raising prices even if demand is slowing.
There are a number of factors that influence the amount that households demand and the amount that firms supply in product (output) markets. The market price is a determinant, both of quantity demanded and quantity supplied. Equilibrium price is the point where the supply curve intersects the demand curve of a good or service. It is the price where there is no tendency for change.
At any moment, one of the three following conditions prevails in every market:
Excess demand: The quantity demanded exceeds the quantity supplied at the current price. This would result in an increase in price (for example, the price people are willing to pay for a ticket to a sold-out sporting event or our previous discussion on the hot holiday toy).
Excess supply: The quantity supplied exceeds the quantity demanded at the current price. This will result in a decrease in price (for example, a liquidation sale of the excess inventory of current-year car models in anticipation of the arrival of next year’s model).
Equilibrium: The quantity supplied equals the quantity demanded at the current price.
A shift in demand or supply would set a new equilibrium price. The new price would reflect the maximum price the market is willing to pay given the new level of demand or supply.
Let’s use the price of a stock as an example, suppose there is a news report that a company was caught engaging in questionable accounting practices that misrepresented the company’s financial performance. Investors’ demand for the stock decreases greatly. Since the number of outstanding shares of stock is the same /unchanged (supply) , the equivalent price for the stock would then drop significantly as investors question its true value. So with products in excess supply someone will most likely sell it at a lower price even if it means reducing margins.
Why so many Economists got it wrong
As we have addressed in previous newsletter it’s important to understand the source of your information and whether or not the writer may have an underlying objective to not disclose all information or to paint a different picture. Most economist work for financial institutions that are in the business of managing your money. Hence, they need to be as optimistic as possible in order to attract investors that will put money into their company’s funds
This is one reason why we think so many economist failed to anticipate the steepest inflation in 40 years.
Outside of a handful of individuals, economists have thus far devoted remarkably little attention to how their theories and models got inflation so wrong. There has yet to be a surge of studies from the National Bureau of Economic Research, the leading outlet for academic economics, on inflation as compared with the gusher of papers on pandemics in 2020.
This would be understandable if economists had only missed by a bit. They didn’t. Inflation at the end of last year was more than double the median projection among economists surveyed eight months earlier and well above the highest forecast. However, it is also important to note that while the media is on fire about rising prices its being compared to 2020 and 2021. Remember we shut the economy down in 2020. We dumped inventories at lower prices, Gas was a negative $50 a barrel in May of 2020. Residents of major metropolitan cities vacated and ran to the suburbs buying up home, people did not pay their rent. (Rent is 30% of the weight in calculating inflation). If we compare prices from May 2019 to May of 2022 prices rose 14.14% over the 3-year period or 4.5% a year. While that is still high let’s consider all the money that was sent to people from the government. The number of people that were too afraid to go back to work. Economic models do not account for all of this. It has never happened before so this is why so many economists got it wrong. They spent too much time in their office looking at their models and not looking at the behavior of the consumer. Their models did not account for any of these behavior variables. Source https://www.wsj.com/articles/on-inflation-economics-has-some-explaining-to-do-11655294432
Understanding Stagflation
There have been a lot of economic terms being thrown around in the media of late. Stagflation is one of them. The term "stagflation" was first used in the 1960s during a time of economic stress in the United Kingdom by politician Iain Macleod while he was speaking in the House of Commons.
While talking about inflation on one side and stagnation on the other, he called it a "'stagflation' situation." It was later used again to describe the recessionary period in the 1970s following the oil crisis when the U.S. underwent a recession that saw five quarters of negative GDP growth.
3 Inflation doubled in 1973 and hit double digits in 1974; unemployment hit 9% by May 1975.45
Stagflation led to the emergence of the misery index. This index, which is the simple sum of the inflation rate and unemployment rate, served as a tool to show just how badly people were feeling when stagflation hit the economy.
Stagflation refers to an economy that is experiencing a simultaneous increase in inflation and stagnation of economic output.
Stagflation was first recognized during the 1970s when many developed economies experienced rapid inflation and high unemployment as a result of an oil shock. The prevailing economic theory at the time could not easily explain how stagflation could occur. Since the 1970s, rising price levels during periods of slow or negative economic growth have become somewhat of the norm rather than an exceptional situation.
A Technical Perspective
We thought it would be helpful to focus on putting volatility into perspective. What exactly to we mean by Volatility? There are many ways in which volatility is defined. We measure volatility using a Volatility Index (VI) which measure movement over a specified period of time. You might find it helpful to visualize volatility in the markets by its “outlier days.” Extreme trading anomalies
To start, let’s define an outlier day. An outlier day on the market (S&P 500) to be any single trading day beyond +/-1.50%. We arrive at this definition by taking the standard deviation of the S&P 500 during a Bullish Market State, dating back to 1950. The daily standard deviation in a Bull Market State is 0.75%. Using a normal bell curve, that would mean that 95/100 trading days should fall between 2 standard Deviations or -1.50% to +1.50%. That would mean for a given year, about 13 trading days would be beyond +/-1.50%.
Bull Market Outliers
Bull markets are considered to be “efficient. They move more on information. They are often characterized with having low volatility, tighter fluctuations, and a series of higher market highs and higher market lows. During the 2021 calendar year we considered it an efficient bull market. Most of the year featured low volatility, even nearing extreme low volatility levels. The market went up, with a series of higher highs and higher lows, and only experiencing 18 “outlier days” beyond 2 standard Deviations for the entire year. That is considered reasonable not too far from the expected number of 13 outlier days.
Bear Market Outliers
Bear markets on the other hand are not efficient, they are often driven by emotional reactions to news and hence we see grater fluctuations. Through the first 6 months of 2022, one would expect see about 9 outlier days max that are beyond +/-1.50%. Remember, all of 2021 we only had 18 outlier days. Year to date the S&P 500 has experienced 41 outlier days. Out of the 116 trading days we have had this year, 41 have been outliers (35%). These outliers have occurred to both the upside and downside. As a result, the S&P 500 has seen a series of lower highs and lower lows. Not good sign
Outlier days can be an indicator of market direction. In 2022, the S&P 500 has had 41 total outlier days, which will likely be 42 at the close of Tuesday. That would make 18 of the outliers up days, and 24 of them down days unfortunately with the down days achieving lower lows. But the reality here is that the S&P 500 is -23% YTD. We expect the rest of the year to follow the same path. Source Brando Bischoff Canterbury Investments
The Week Ahead
U.S. markets were closed Monday in observance of the Juneteenth holiday. This week’s economic calendar focuses on global growth, with June flash PMI readings from the U.S, Eurozone, UK, Japan, and Australia. The reports will provide insights on how ongoing supply issues and soaring prices are affecting the manufacturing and services sectors.
In the U.S., the stressed housing industry updates with existing and new home sales on Tuesday and Friday, respectively. Fed Chair Powell begins two-day Congressional testimony on Wednesday, and the stress test results for U.S. banks are tentatively scheduled for Thursday. Also keep an eye on Fedex’s earnings release after the close that same day, a key barometer of rising costs for U.S. corporations. Internationally, UK CPI could approach 10% as households struggle with sharply rising food and energy costs. Europe’s docket includes German PPI along with the closely watched IFO business survey. In Asia, Japan’s headline inflation may see a rare uptick given the country’s reliance on imported commodities.
This article is provided by Gene Witt of FourStar Wealth Advisors, LLC (“FourStar” or the “Firm”) for general informational purposes only. This information is not considered to be an offer to buy or sell any securities or investments. Investing involves the risk of loss and investors should be prepared to bear potential losses. Investments should only be made after thorough review with your investment advisor, considering all factors including personal goals, needs and risk tolerance. FourStar is a SEC registered investment adviser that maintains a principal place of business in the State of Illinois. The Firm may only transact business in those states in which it is notice filed or qualifies for a corresponding exemption from such requirements. For information about FourStar’s registration status and business operations, please consult the Firm’s Form ADV disclosure documents, the most recent versions of which are available on the SEC’s Investment Adviser Public Disclosure website at www.adviserinfo.sec.gov/
The Optimized Investor
