
Politicized or just plain Incompetent & Other Economic News
from the Week Ending June 10th 2022

The content of this Newsletter is to provide you with Economic insights to assist you in making better decisions with your investments. Unlike many other financial periodicals we will not mention specific companies, unless it is relevant to an overall economic issue. We welcome your questions on economic concerns and will address in our newsletter. just email us at info@optfinancialstrategies.com #FinancialAdvisor,#investmentmanagement #wealthmanagement #financialplanning #retirementplanning #401kplans
Another brutal week in the markets with all 4 of the major indices dropping between -4.58% (DOW) and -5.6% (NASDAQ) for the week. It also pushed the S&P index and Russell 2000 right up to the edge of the -20% mark again.
Most of last week’s decline came on Friday as inflation data showed US consumer prices rose more than expected in May, adding to investors' concerns ahead of a rate policy meeting being held this week by the Federal Open Market Committee. The big question is whether or not the Fed will increase interest rates more than the expected 50bps.
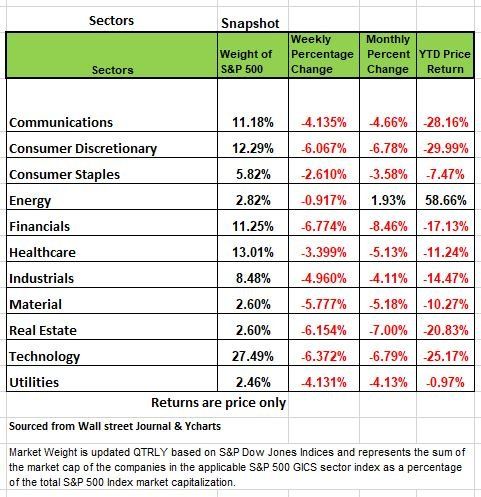
All of the sectors were down significantly last week with Consumer Discretionary, Financials Real Estate and Technology all down more than -6%. This week, the FOMC meeting will take center stage, investors will also be focusing on data including May retail sales, building permits, housing starts and other leading economic indicators.
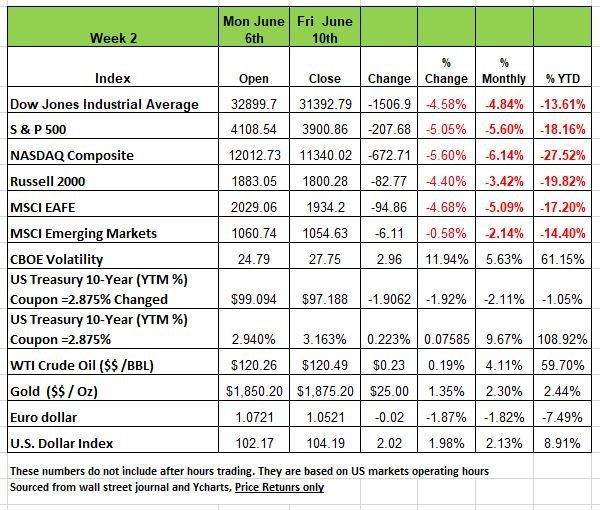
Treasury bond yields skyrocketed across the yield curve last week as the bond selloff deepened. Last week’s rise in Treasury bond yields was highlighted by the two-year Treasury note hitting its highest level in nearly a decade and a half. May Consumer Price Index (CPI) release was the leading cause for the upward move in Treasury bond yields. The CPI increased 1.0% in May, 0.3% higher than expected, with energy prices up 3.9% and food up 1.2%. Real wages (ex-inflation) were down 0.6% last month. According to Bloomberg, in response to the higher-than-expected May CPI data, the front-end of the yield curve repriced to a 50% chance of the Federal Reserve increasing the policy rate by 75 basis points as early as the July Federal Reserve policy meeting. Barclays revised their forecast and now call the Federal Reserve increasing the policy rate by 75 basis points in the June policy meeting. Wednesday we will find out how accurate they are.
Politicized or just plain Incompetent
“I think I was wrong then about the path that inflation would take,” This is what Treasury Secretary Janet Yellen told CNN on June 1st, referring to a 2021 comment that there was a “small risk” of inflation. She was also wrong about the housing bubble back in 2008. Last week, she made a comment that a recession was “unlikely”, "There's nothing to suggest that there's a recession in the works,".
Really?
Ms. Yellen is not the only person we are pointing a finger to; Fed Chair Powell has been way off his mark as well. In fact, prior to being reconfirmed, his tone about the economy was completely different. These are not minor issues. We struggle with how we got to this point. We know Janet Yellen and most of the people at the Fed are extremely well educated. It’s fair to say they are bright. The Federal Reserve and the Treasury employ more PhD economist than any other institution in the world. But the mistakes being made seem to be so reckless, it borders incompetence. The economist at the Fed have access to more data that we do and yet we have, like many other seasoned financial professionals have seen the writing on the wall for a while. It’s obvious. Jamie Diamon CEO of JP Morgan, the world’s largest bank stated that he was bracing for an “Economic Hurricane” “You better brace yourself”
If Mr. Diamon can see the warning signs, then the Fed should be seeing them as well. Last week we wrote about why we think unemployment will soar, with so many poorly run businesses that have been kept afloat by an abundance of cheap money, the thin margins will now be eroded by higher interest rates. This will soon lead to layoffs on a large scale.
Both fiscal and monetary policies are made based on the evaluations of these “experts” Ms. Yellen also stated. “There have been unanticipated and large shocks to the economy that have boosted energy and food prices and supply bottlenecks that have affected our economy badly that I, at the time, didn’t fully understand, but we recognize that now.”
The rise in gas prices is not only the result of the Ukraine /Russia conflict. It is the administration’s policy on fossil fuels. We knew that prices would rise prior to the conflict.
The rise in fuel prices started back in 2021 and the cut back in Americas own production of oil has impacted prices more significantly that the Ukraine/Russia conflict. This where we all need to understand that regardless of your position of climate change that there will always will be a cost associated with extreme shifts in any policy. All economic downturns are the result of poor decisions and the more politics that get infused into our decision-making process the more costly they will be
These mistakes torpedoed the economy in 2008 and will do the same in 2022-23. As we have addressed in past articles, our concern is not if we have a “recession” but how deep and painful it will be.
You Decide based on What the Data Says
Employment
In today’s world, the media, including the financial media, appear to report information with a point of view, perhaps even with an agenda. Journalist are expected to get it accurate. Without digging deeper, one would never get the whole story. As we discussed in our May 9th newsletter the +428k net new jobs reported in the Payroll Survey for April was actually closer to +148k once all the nuances were considered.
While the, May’s Payroll Report (+390k) was actually somewhat better, after considering that about +100k was added from the assumed growth of small businesses (the Birth/Death imputed add-on), the counted number of +290k falls to under +200k and if ADP’s count of small business jobs (-92k) is used the number is weaker.
Nowhere in the media did we see any mention that the Retail Sector laid off -61k people, or that the factory workweek and overtime hours declined. These are important numbers to consider
In fact, overtime hours are down three months in a row; the first time this has happened in seven years.
In addition, those working part-time for economic reasons (they can’t find full time because business is slow) rose by +349k and has now risen in three of the last four months.
ADP is the largest payroll company in the U.S. They are able to count the number of employees who get paid from their internal records, and they can divide them by the size of the businesses they serve. The ADP data is trending lower, much lower as seen from their monthly total employment estimates: Dec: +780k; Jan: +512k; Mar: +249k; May: +128k. For small businesses, which are much more sensitive to changes in the economic environment than are large businesses, ADP’s numbers show May: -92k and April: -123k. Year to date, the number for small business employment is -278k. In addition, the weekly data on Initial Jobless Claims, while still fairly low, have started to increase, and layoff announcements (Challenger Gray) are on the rise. Thus, we think that the employment data will continue to deteriorate as the year progresses.
The Inventory Overhang
Historically past recessions started with an abundance of inventory, but technology and the use of computers have allowed us to keep inventory levels at a minimum with “just in time management systems”. But the pandemic threw a wrench into that system. Now inventories are too high. One could have gleaned that from the TGT and WMT reports that consumers purchased fewer discretionary items. Wholesale inventories are up +24% and retail inventories +15% and stand at a 38-year high. We also note that the ports off CA are reporting near record unloading. This indicates that supply chains are becoming unclogged and that inventories will continue to rise even further.
Much of this appears to have been a function of the “shortage” narrative that was a major theme throughout 2021. That narrative caused businesses to order early as they worried about not having goods on their shelves. Now they have the goods, but consumers aren’t buying them. We expect this excess inventory will go “on sale.” (That should help the inflation issue!).
Weakness in the Housing Market
The New Home sector is a major contributor to GDP. We have seen new housing inventory go from a couple of months supply to nine months. Mortgage applications have been falling on a week-to week basis over the last several months and are -21% lower than a year ago. This is obviously a function of rising mortgage rates which have gone from the 3% area to more than 5.5%. Even higher for consumers with less than stellar credit numbers. This means that the monthly mortgage cost for a median priced home a year ago is now 50% higher. April’s Existing home sales are down nearly -6% Y/Y, pending sales -9% and new home sales -12%.
Worse, the rise in interest rates have caused a -75% Y/Y falloff in mortgage refinances. Why is this important? Because consumers often borrow against the appreciated value of their homes for big ticket items, like home improvements, or finance an expensive vacation, or even to purchase a car. The fact that such applications have fallen so far, so fast implies a dramatic slowdown in such purchases. In fact, the data say that overall refi-mortgage applications are at a 22-year low.
Big-Ticket Items Tank
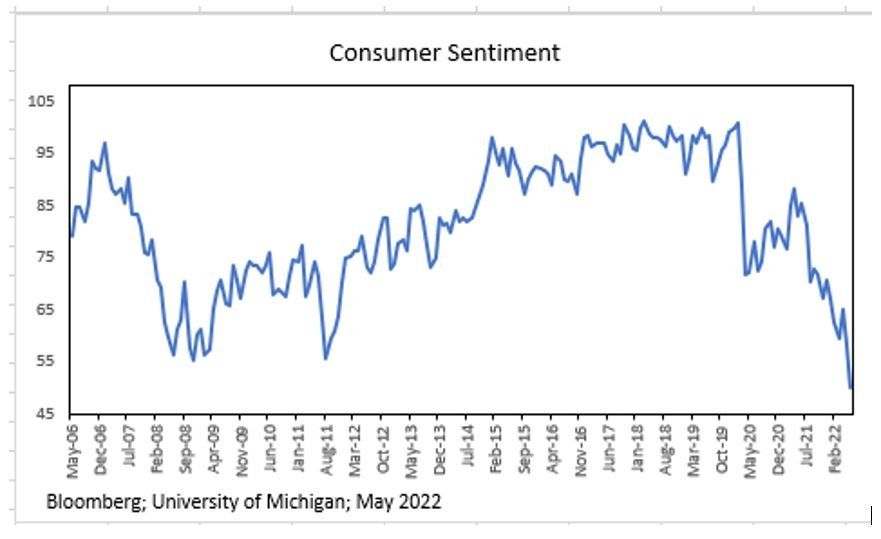
The University of Michigan’s Consumer Sentiment Survey has indicated that consumers were not in any mood to purchase homes, cars, or other big-ticket items. We now see new car sales (passenger cars and light trucks) were down -30% Y/Y in May. The U of M’s sentiment gauges continue to point lower. The chart below shows that the overall Consumer Sentiment Index for June has fallen to the lowest level in its history. Because U of M’s sentiment gauges continue to point lower, we can expect that major purchase statistics will continue to deteriorate for the foreseeable future.
The Tight Labor Market
The pundits that are champions of the “mild recession” narrative say the economy is still vibrant and point to the labor market. The Unemployment Rate is still 3.6% and “Help Wanted” signs are everywhere you look. The truth is that the tight labor market preceded the pandemic. Part of this issue is demographic in nature, with baby boomers retiring, their replacements aren’t 100% there.
But much of the problem has been caused by the narrative itself. That is, the view that there aren’t enough workers has caused both over-hiring and labor hoarding. We see this in the productivity statistics. In Q1, productivity eroded at an annual rate of -7.5%. That number is huge, and we haven’t seen such a number since 1947! Over the last three quarters, productivity has fallen at -1.9% annual rate. That’s a harbinger for recession as poor business results will cause right-sizing.
While the Initial Jobless Claims are still fairly low, they have recently started to rise. As retirees see their portfolios shrink from non-active management styles, we expect many try to reenter the work force. We also note that layoff announcements are on the rise.
The Consumer Strength Myth
Part of the healthy economy narrative has been that consumer balance sheets are strong and that they have significant savings, so consumption will remain elevated. But again, that is ancient history. The savings rate, which was over 30% when Washington D.C. was giving money away, has now fallen to a 14-year low of 4.4%. There really is not much there to spur consumption and if the recession is bad that will be gone for many in a matter of weeks.
In addition, over the last four months, Americans consumers have gone on a borrowing binge. There has been a record run-up in credit card debt to the tune of $38 billion in April alone and $120 billion over the last four months (11.2% growth and a 22% annual growth rate). This we feel is an attempt for many to maintain their living standards in the face of rising food and fuel prices. As one would expect, delinquencies are also on the rise: 60-day delinquencies for sub-prime credit card holders are up six months in a row; 11% of credit card holders with credit scores below 620 are delinquent, and 8.5% of car loans/leases are also delinquent. Does this sound like a strong economy?
Inflation
The May CPI number released on Friday (June 10) was quite ugly, the Y/Y inflation rate rising to 8.6%. The main culprits, were food which was up +1.2% M/M (+10.1% Y/Y) and energy (+3.9% M/M; +34.6% Y/Y).
This translates to another tax on the consumer. The real spending power of households has declined, especially the middle-class income bracket. With summer and vacation season upon us many Americans may not be able to afford the vacations they planned. In addition, fuel cost has force airline fares up. Tickets rose double digits and are now 38% higher than a year ago.
The “core” inflation rate (ex-food and energy) rose 0.6% and only fell on a Y/Y basis (6.0% from 6.2%) because of “base effects,” the denominator (moving from April 2021 to May 2021) spiked higher.
Regardless of the most recent inflation data we are still holding our position that this bout of inflation is “transient.” We know that the media and politicians have condemned this word and who are we. So here is a rationale; the issue with the meaning is that it is not defined by a time frame, so while many want to assign a time frame like 2 or 3 months. The term actually means “not permanent.”
With that what we really need to do is to look deeply at the forces at work here that are attributing to this inflation environment.
The main culprit is due to the governments flooding the economy with money during the pandemic, people did not work our production was reduced, demand soared, prices rise. Now that demand has subsided, (excess inventories) we are holding our position that inflation will recede in the next 6-12 months. This of course is assuming there are no major events such as an escalation in the war.
Below are a few other reasons why we believe that there will be downward pressure on inflation
Fiscal policy has turned from giving away money to one of a significantly shrinking deficit;
The money supply is now contracting and the velocity of money is still near record lows;
The Fed has increased interest rates, and they finally began Quantitative Tightening (QT); so, liquidity is drying up and that will impact financial markets.
Vendor delivery delays are easing – the ISM measure is at a 14-month low;
The supply chain logistics appear to have eased – the near-record unloading’s at the CA ports support this view;
Multi-family units will come to market at a record level in the 2nd half of 2022; that will stop the rise in rents. Keep in mind rent is 30% of the weight in calculating CPI
The U.S. dollar is strong which reduces the cost of foreign goods;
Commodity prices appear to have peaked:
Lumber: -43% over the last 3 months;
Steel rebar: -22% from its peak;
Iron Ore: -35% from its peak;
Baltic Dry Index: -20% since mid-May;
Major retailers will be reducing inventories by placing good on sale holding inventory too long is too expensive with these interest rates;
Wage growth has slowed to about half of its 2021 rate; it will further moderate as the unemployment rate rises.
The Atlanta Fed’s GDP forecast for Q2 is now 0.9% (June 8), down from 1.9% on May 27 and 2.5% on May 17. It is too early to tell if this number will be lower or even possibly even negative
U of M’s overall Consumer Sentiment Index dove to 58.4 (prelim) in May from 65.2 in April – that’s a big move for that index, and, as we discussed earlier, it has proven to be a leading indicator for car and home sales. Source Bob Barone Economist Ph'D
Risk Tolerance
Every financial advisor has some type of Risk Tolerance Assessment process. The vast majority are too
basic, and are merely designed to satisfy the minimum compliance requirement. One of the most vital pieces of information a good advisor can have, is an understanding of their client’s tolerance for risk. When we are in a upward moving market and portfolios values are increasing there are few complaints. However, in an environment like the one we are in, its not so easy to just say it will rebound. Below we address a few common issues with these evaluations and how that can impact both financial advisors and their clients when it comes to determining risk tolerance and how it may affect the client.
Accuracy
Most Risk Tolerance Assessments present investors 8-10 questions and conclude with the client /investor being slotted in one of 3 - 5 allocation models, such as Aggressive, Moderate, or Conservative. The problem here right from the start is that this language is vague and not very specific to a client’s real appetite for risk.
A majority of investors are hence classified as “Moderate.” But the very term “Moderate” means
different things to different investors (or for that matter, different advisors). Therefore, the expected risk level of a portfolio can be interpreted very differently. It’s not uncommon for one investor to believe that a portfolio with half stocks and half bonds be described as “Moderate,” while other investors would describe “Moderate” as having 60 or even 70% equities in the allocation. Furthermore bonds, once considered a safe conservative investment are now equally as volatile as equities.
Shifting to a different allocation Model
Naturally, there are some investors that are categorized as Aggressive or Conservative as well. But when an investor decides to change their allocation model (their risk directive) it can result in very large change all at once, usually in the form of a loss. If they happened to make this election at a market peak to reduce risk from say “Aggressive” to “Moderate,” it can be great for their returns. However, normally they make a change at inopportune times, driven by emotions, it can cause their portfolio to suffer greatly.
This places great onus on the specific timing of the change from one risk model to another. Most investors are better off with a gradual shift at a pace commensurate with their unique circumstances and most important objectives.
Risk Tolerance Assessments don’t generally indicate how risk tolerance is likely to evolve through time. All too often, advisors do not revisit their clients Risk Tolerance Assessment nearly enough. When material financial events occur, such as new information about family, retirement, large expenses, or inheritance, it is wise to revisit on a regular basis, no matter how well it was analyzed previously. Understanding the general pace at which investment risk should evolve through time is very helpful in understanding how frequently gradual adjustments should be made, even without any major changes.
Age
Risk Tolerance quizzes tend to focus too much on one’s personality (willingness to take risk) and age, and not enough on the investor’s actual psychological ability to take risk. These quizzes tend to be too simplistic and aren’t customized for the investor’s specific cash-flow assumptions (both in and out of their portfolio).
The old rule of thumb “Own your age in bonds,” while very specific quantifiable, lacks customization. In addition, that philosophy has not worked in the last 10 years with the low interest rate environment we have been in. Common sense tells us that not all 55-year-olds should have 45% equities and 55% in bonds. There are quite a number of other important factors that need to be considered, such as the client’s savings rate, spending rate, inflation, lifestyle and cash flow needs, just to name a few.
Age should certainly be a material factor in determining a client’s risk allocation, but its importance can vary greatly from client to client and especially during unique environments like the one we are in now.
Reasonable Goals
Risk Tolerance Assessments don’t generally address the reasonableness of the set of assumptions made by an investor. No one wants to formulate an opinion or give advice about how much investment risk should be taken if the assumptions used aren’t reasonable. If the assumptions suggests that an investor’s money will run out at 75, it’s probably not a realistic analysis.
It’s important to know when assumptions aren’t realistic, and to gauge how to make them more realistic by delaying retirement, increasing current savings, or decreasing lifestyle in retirement.
Risk Tolerance Assessments don’t often illustrate how sensitive the result is to each assumption made.
The reality, however, is the fact that investors don’t’ always know what assumptions to make. They frequently guess, if lucky they are educated ones, which means it’s important to know which guesses are really important and need to be thought through.
Measuring risk
Perhaps the greatest risk to investors are the contents of the portfolio itself, many investors (unfortunately advisors too) do not know how to measure risk. In addition, the creation of TAMP’s (Turnkey Asset Management Programs) were designed to free up an advisor’s time. These computers run programs allow advisors to spend more time on acquiring new clients than on managing portfolios. Most of the securities used in these programs are made up of Index, ETF and mutual funds Without understanding the underlying investments there may be redundancy of investment holdings which could increase the risk of the portfolio depending on weight of the security and the number of redundant holdings in these funds. Keep in mind not all “mid-cap” funds are designed equally. Its important to know exactly what the underlying holdings are in each fund.
Lastly most portfolios using MDT (Modern Portfolio Theory) reinvest dividends and capital gains back into the fund. Many advisors fail to recognize the need to turn off the reinvestment function and design a portfolio to generate income such as dividend and interest payment for retirees. By the time a client reaches retirement the client should not have to liquidate assets to live, this increases the risk of having to liquidate when the market is low and reducing assets that could produce income
Technical Perspective
The markets responded to the inflation news by dropping -2.91% (S&P) on Friday. On Monday 13th, the S&P 500 closed down another -3.88%. The S&P 500 is now in that “-20% bear market territory.”
20-Year Treasury Bonds were also down -3% on Monday. In the last 3 days, through mid-morning on Monday, the S&P 500 is down -8.9%. There has been a lot of selling among investors.
Prior to last week, markets had been 100% overbought according to AIQ Trading Expert Pro’s Overbought/Oversold Expert Rating, and therefore expected a decline. Now, through Friday, the S&P 500 is 95% oversold. We would expect that to be nearing 100% after Monday’s close.
The inflation news is not what has driven the markets to this point. We all know what the markets have done this year, and the declines experienced Thursday, Friday, and now Monday have been relatively common in 2022. It was not the news headlines that had driven the markets to this point. In fact, most economists agree that the markets are actually a leading indicator for the economy. In other words, markets often decline before the economic indicators are at their worst and rise prior to signs of economic improvement.
What drives the markets?
So, if the markets lead the economy, then what leads the markets? The answer to that question is “changes in volatility.” Market price fluctuations are a direct result of the actions of buyers and sellers (investors). If demand is greater than supply, prices go up and if supply outweighs demand, prices go down. Bottom line, the beliefs, emotions, and opinions of investors are what drive the markets. These emotions of investors are reflected in the market’s volatility.
Right now, we know that volatility is high, meaning that markets are very emotional. You wouldn’t expect to see a +/-2% day during a low volatility bull market. During today’s environment, it’s starting to feel like the norm. We incorporate our knowledge on changes in volatility to helps our clients reduce risk. Almost every one of our market updates has mentioned rising volatility and how it is a bear market characteristic. In fact, we began to see rising market volatility back in January of this year. Source Brandon Bischoff Canterbury Investments
The Week Ahead
With each passing week and new data point the Fed’s hopes for a soft landing seem less likely. The June FOMC meeting arrives on Wednesday with a widely expected 50bps rate hike and confirmation of another in July. However, with the most recent CPI numbers coming in hotter than expected pundits are betting on a 75bps to 100 bps increase. Of interest will be the Fed’s updated forecasts and how that may influence policy decisions later in the year. The committee will also want to see how recent actions have influenced the economy, so Wednesday’s retail sales report will be closely watched, along with regional manufacturing updates, industrial production figures and housing news throughout the week. U.S. PPI will bookend last Friday’s scorching consumer inflation release. Elsewhere, the Bank of England may take a more cautious approach to rates as growth slows and recession risks rise. Monthly GDP, employment data, and retail sales will add color to the UK economic picture. In China, May’s retail sales and industrial production numbers emerge after recent PMIs showed improvement but remained in contraction
This article is provided by Gene Witt of FourStar Wealth Advisors, LLC (“FourStar” or the “Firm”) for general informational purposes only. This information is not considered to be an offer to buy or sell any securities or investments. Investing involves the risk of loss and investors should be prepared to bear potential losses. Investments should only be made after thorough review with your investment advisor, considering all factors including personal goals, needs and risk tolerance. FourStar is a SEC registered investment adviser that maintains a principal place of business in the State of Illinois. The Firm may only transact business in those states in which it is notice filed or qualifies for a corresponding exemption from such requirements. For information about FourStar’s registration status and business operations, please consult the Firm’s Form ADV disclosure documents, the most recent versions of which are available on the SEC’s Investment Adviser Public Disclosure website at www.adviserinfo.sec.gov/
The Optimized Investor
