Secure Act 2.0 plus a Review of the Economy & the Markets
for the Week Ending Sept 23rd 2022

The content of this Newsletter is to provide you with Economic insights to assist you in making better decisions with your investments. Unlike many other financial periodicals we will not mention specific companies, unless it is relevant to an overall economic issue. We welcome your questions on economic concerns and will address in our newsletter. just email us at info@optfinancialstrategies.com #FinancialAdvisor,#investmentmanagement #wealthmanagement #financialplanning #retirementplanning #401kplans
Markets Week in Review
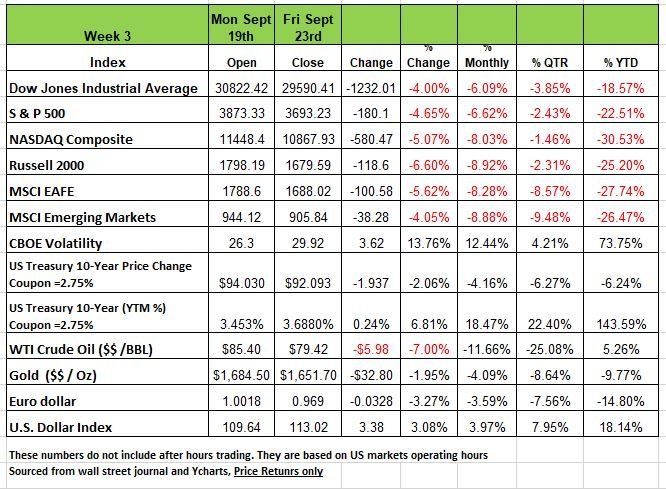
Another difficult week for investors as all 4 of the major indices sank more than 4% for two consecutive weeks. The largest drop was seen in small caps with the Russell 2000 dropping -6.6% on the week followed by the NASDAQ at -5.07%, the S&P -4.65% and the DOW with a -4% decline. Much of this activity came off Fed Chair Powell’s press conference last Wednesday announcing that the Fed was raising interest rates another 75 bps. But that was expected, what shook the markets was the dot plots that Powell referred to and the Fed’s determination to curb inflation. In addition, the Fed is sharply raising its year-end benchmark rate outlook. The federal funds rate, now in a range of 3% to 3.25% with the year-end target going to 4.5%, up from 3.4% previously.
Other issues that came about from the press conference was that Powell announced that the Fed’s projection for real GDP to be approximately .2% in 2023. This is the fed’s way of stating that they are expecting the economy to be in a recession. The rate increase by the Fed's FOMC was followed by similar moves globally by officials at other central banks, including the Bank of England.
On Friday, investors' concerns about the impact on global economic growth escalated as data showed a sharp decline in economic activity in Europe, raising the risk of a recession there.
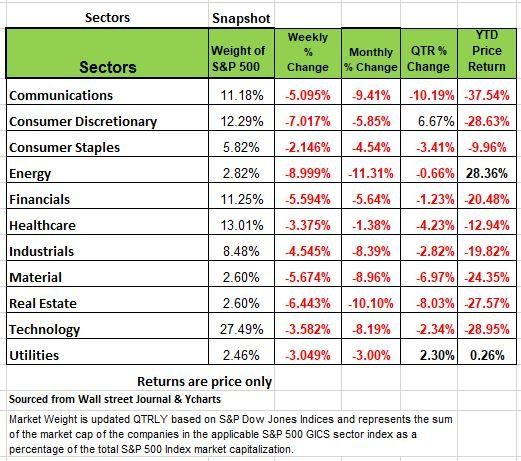
All 11 of the S&P sectors were down, declines ranged between -9% energy to -2.1% consumer staples
Treasury yields increased significantly last week amid interest rate hikes from central banks around the world, once again keep in mind for yields to rise Bond prices must decline. The 2 years treasury surpassed 4% yield on a 3.25% coupon. Currently the 2 year is still inverted over the 10-year treasury signaling the markets concerned for the economic outlook. This Friday not only end the month but also the 3rd quarter of the year. As we mentioned last week the Atlanta Fed’s GDPNow forecasting model was showing a +1.2 growth for Q3 as of September 20th that number was revised to +.03%. The next release will be on Tuesday Sept 27, we expect the final number to be 0 at best, but most likely -.03
Economic Climate
It is fairly apparent from the incoming data, that the economy has entered a Recession. If Q3’s number comes in negative again it will be 3 consecutive quarters of negative economic growth. At this point I think it will be hard for anyone to deny the state of the economy. But what is more troubling is that the the Fed, clearly ignoring the incoming data and focused only on backward looking indicators (the Y/Y rate of inflation & the unemployment rate). This has caused the Fed to act more hawkish and has now told the market that it intends to raise rates another 125 basis points before year’s end and even more in 2023.
The use of the dot-plot has historically had a 37% correlation with what actually transpires as far as rates are concerned, and it is clear that the FOMC members are nowhere near consensus for 2024 and 2025 rate levels. July’s M/M CPI was -0.1% and August’s was +0.1%. Over those two months, the headline CPI was flat (i.e., 0%). Seems like someone at the Fed should recognize this, especially since monetary policy impacts the economy with long and variable lags. But this Fed is still moving forward with increasingly restrictive policy, seemingly impervious to the lagged impacts of its prior rate hikes.
These poor decisions are done in the face of two consecutive quarters of negative GDP, a potential 3 quarter of negative growth and nearly daily evidence that the economy is contracting.
Powell has referenced Paul Volcker several times, both in public statements, and in his remarks to Congress, holding Volker out as a hero to be emulated. Volker, of course, did slay the inflation dragon, but the cost was two significant recessions. And Volker knew that monetary policy acted with long lags because he moved the Fed Funds rate down when the Y/Y inflation metric was still over 11%! The continuance of ever more restrictive monetary policy (including Quantitative Tightening (QT)), which has already pushed the economy into the initial throes of Recession, will only make this Recession deeper longer and more painful.
So lets taker a look at some of the evidence to support our opinion
Inflation
The +0.1% M/M rise in the headline CPI in August (consensus was -0.1%) has led some economists to suggest that the inflation has become endemic. The real issue in the report was the +0.6% rise in the “core” rate (ex-food and energy). But there is a lot of evidence pointing to signs of easing price pressures (apparently everywhere but in the official CPI number!).
- Gasoline prices fell -9% in August and have continued to fall in September Fridays close was down below $80/barrel.
- Natural gas prices have stabilized. This will soon impact utility bills, but we acknowledge that the situation in eastern Europe can change this, especially as winter approaches.
- There have been significant declines in grain, dairy, and other agricultural prices which we think should translate to lower or stable prices at the grocery store.
- Used vehicle prices at auction have fallen significantly.
- Improvements in the supply chain will drive down consumer goods inflation, and the stronger dollar will continue to push down the prices of imported goods (which fell -1.0% in August and -1.5% in July) The Dollar index (DXY) closed Friday at 113.02
- Rents which is the largest contributor to the CPI number will continue to put upward pressure on measured inflation, thank all those tenants that refused to pay rent with Federal income allowances, another issue with rents is the antiquated way the BLS measures them, asking people how much their home would rent for. But private-sector measures of rents have already slowed sharply with more multifamily homes entering the market.
- There are signs of disinflation in the prices of services. Travel-sensitive categories, which include hotels and airlines, have seen declining prices recently.
- The CPI version of healthcare service costs is still accelerating, but the more comprehensive PCE measure (which is what the Fed looks at) is trending lower.
- There was little evidence in the CPI report of falling prices due to inventory liquidations, but those are real and expect them to be reflected in Sept numbers.
- Core crude PPI (ex-food and energy – at the very early stages of production) has deflated -1.6% Y/Y in August. A year ago, this was +42%!
- Core intermediate PPI (ex-food and energy for semi-processed goods) fell -0.9% M/M in August and was -0.2% M/M in July.
- Incoming data continues to confirm our view that inflation will soon subside. We expect both headline and core inflation to fall more quickly in the coming months than Fed officials currently believe.
Labor Market
When we look at the August’s payroll data, we find some issues with the math. On a not-seasonally adjusted basis (NSA), the YTD payroll through August, show a rise +2.2 million. But the seasonally adjusted (SA), is +3.5 million, the number that the media wants to use. That means that there is a 1.3 million difference. Theoretically, over the year, the SA process is supposed to net to zero with the NSA number. So, this means that one of two things will happen either:
a) the seasonal factors will be negative to the tune of 1.2 million payrolls in the September to December period (that’s 300,000/month!)
b) the past data will get adjusted downward.
If 1) is the case, markets will react; but if 2) occurs, there will not be much of a reaction in fact we doubt it will even be reported by the media or the pundits. Nevertheless, the labor market is simply not as robust as the Fed and media lead us to believe. In fact, the Fed, itself, sees the unemployment rate rising to 4.4% in 2023, which implies Recession. We think this is overly optimistic and think that the U3 rate will have a number north 5%.
There is a lot more data to look at, but we are not going to bore you with everything. The rising strength of the U.S. dollar will have a negative impact on exporters of U.S. products. The cost to other countries will make U.S. items unaffordable. The Eurodollar is now below par to the U.S. dollar and the Brazilian Real is 5.35 to one U.S. dollar. In mid Aug it was 5 to 1 that is a 7% drop in value in just under a month.
It’s unfortunate that the people we trust the most are compromised and playing politics more than doing their job. Before Bernanke and his philosophy of transparency the Fed did not hold so many press conferences, the board governors did not run to reporters be interviewed and jockey to media attention, the markets dealt with the changes when they happened, not with so much speculation based on an insider’s opinion. Some of the information & data provided by Economist Bob Barone Ph’D
SECURE Act 2.0
An Update on Potential Provisions
Leave it to politicians to continue making changes and complicate the employee benefit landscape. Earlier this year Congress passed the Securing a Strong Retirement (SSR) Act, and two different U.S. Senate committees also advanced their own retirement savings-focused legislative proposals:
The Retirement Improvement and Savings Enhancement to Supplement Healthy Investments for the Nest Egg (RISE & SHINE) Act from the Health, Education, Labor, and Pensions Committee; and the Enhancing American Retirement Now (EARN) Act from the Finance Committee.
A combination of the provisions provided in these three acts may ultimately create the final version of what has been dubbed the SECURE Act 2.0. Some of the significant provisions under review and discussion include the following:
Mandatory Automatic Enrollment & Escalation
Employers that establish defined contribution plans (401K) could be required to automatically enroll newly eligible employees at a pre-tax contribution amount of 3% of pay.
Contributions would automatically increase annually by 1% up to at least 10% but not more than 15% of pay. Employees could opt out of automatic enrollment and/or escalation at any time
Exceptions are made for small businesses with 10 or fewer employees, new businesses (those in business for less than 3 years), church plans, and governmental plans.
Expansion Of Catch-Up Contributions & Roth Tax Treatment. Increasing the annual catch-up amount to $10,000 for participants ages 62 through 64 beginning in 2023. This higher limit would also be indexed for inflation in future years.
Currently, catch-up contributions to qualified retirement plans offered by employers can be made on a pre-tax or Roth basis (if the employer permits). SECURE Act 2.0 provides that starting in 2023, all catch-up contributions to employer-sponsored qualified retirement plans would be subject to Roth tax treatment. This means allowing Roth Matching Contributions
Employers could have the option of permitting employees to elect some or all of their matching contributions to be treated as Roth contributions for 401(k) plans. Employer matching contributions designated as Roth contributions would not be excludable from the employees’ gross income.
The SECURE Act increased the age at which plan participants are required to begin taking mandatory distributions to 72. It could increase the required minimum distribution age to 73 in 2022, 74 in 2029, and 75 in 2032.
The SECURE Act expanded eligibility for long-term, part-time workers to contribute to their employers’ 401(k) plan after 3 years of service, beginning January 1, 2021. SECURE Act 2.0 could expedite the addition of long-term, part-time workers as eligible participants by shortening the period for eligibility from 3 to 2 years, beginning January 1, 2021.
Authorize Student Loan Matching While the IRS has opened the door to allowing employers to make 401(k) matching contributions based on employees’ student loan payments, even if employees are not making retirement contributions themselves, compliance concerns have been a sticking point due to the absence of authorizing legislation.
SECURE Act 2.0 could provide the needed statutory basis for employers to adopt this feature. The matching contributions for student loan payments would be required to vest under the same schedule as other contributions.
Bipartisan support for many of these provisions make it likely that a bill will end up on the president’s desk by year end.
Feel free to consider Optimized Financial Strategies as your resource for information on Retirement plans, Employee Benefits or Portfolio management and contact us with any questions.
A Technical Perspective
For those new readers to our newsletter technical analysis is an investment strategy /trading discipline that relies on identifying opportunities by analyzing statistical trends gathered from trading activity, such as price movement and volume. While no one can identify the bottom and peak price of a security, technical analysis tries to identify opportunities close to it.
The last few weeks have been stressful for investors all weekly movement in the markets have been negative. Through Friday’s close, the S&P 500 is down almost -14.5% from its August high and very close to its low point for the year.
In just the last week, all but one day (Monday), were down at least -0.80%, with two of those days being “outlier” days (a trading day beyond +/-1.50%). According to the media, this all comes as a reaction the Fed’s “hawkish” action, on top of high inflation.
Markets tend to take extreme measures in discounting the news cycle. Financial markets tend to react emotionally and bottom when the news is at its worst, well before things appear to get to better. That’s not to say that we have now seen a market bottom, but it is to say that markets tend to do the opposite of what is expected. It would be a bad decision to throw in the towel after a rapid decline. A crazy downward move will often be followed by an equally crazy upward one.
Market Sentiment
One good indicator of how investors are feeling comes from the American Association of Individual Investors, who survey individual investors on where they think the market is going in the next six months. The AAII has been conducting this survey weekly since 1987. The Sentiment Survey is a contrarian indicator. It has found that unusually low levels of optimism have led to higher-than-average returns, while high levels of optimism have led to lower returns. This coincides with the fact that investors typically feel the worst at market bottoms, and the best nearest market peaks. The latest survey, from 9/22/2022 showed that only 17% of investors were bullish, while 60% were bearish. That is the lowest percentage bullish and highest percentage bearish for the year.
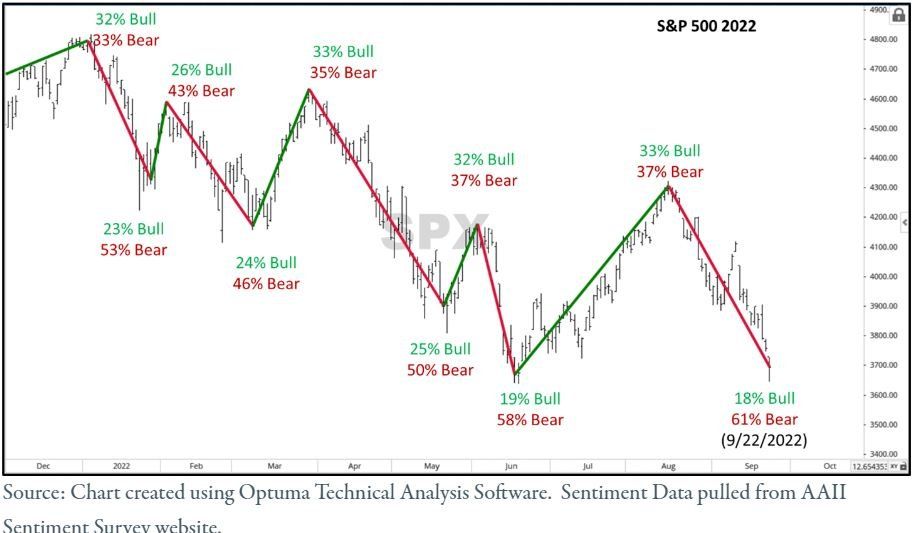
The chart displayed above shows the bull/bear sentiment following various market swings in 2022. For reference, the historical average of investor sentiment has been about 37% bullish and 31% bearish. You can see that at each relative market low point, the percentage of bulls has declined from the previous peak, while the percentage of bears has significantly increased. Each time the investor sentiment has gotten more bearish, the market has rallied, and the percentage of bearish investors has declined.
The last sentiment survey results were published on 9/22/2022 (last Thursday). I am unsure when the results were put in, but they were presumable prior to Thursday’s decline, and prior to Friday’s larger drop. Market sentiment has probably become more bearish following those movements.
Even so, the 61% of investors bearish is the 4th largest percentage of bears since the survey’s inception. The number one largest percentage of bears occurred on 3/5/2009, two days prior to the S&P 500’s bottom during the financial crisis. The next two largest percent bearish occurred in 1990, during a fast -17% decline, which preceded a +20% rally over the following three months. This is also the fourth largest negative spread between percentage bulls and percentage bears (bulls – bears) since inception.
The survey’s record does note that low levels of optimism have yielded better results than high levels of pessimism historically. Even so, the 17.73% of bullish investors is ranked in the bottom twenty for percent of investors bullish. If you would like to read more about the investor sentiment survey, a description can be found here.
Short Term strategy
Make no mistake about it, this is a bear market. But do not get hung up in the news. The news will look its worst after the market has already bottomed. Right now, for the short-term, this market is oversold. We have said before that a market can continue to be oversold, but it does increase the probability of a “bear” market rally.
Keep in mind that bearish investors are already in cash. The “flight to safety” has not been to bonds, nor has it recently been to commodities. The flight to safety has been to cash. There are not many people left to sell and there is a lot of cash on the sidelines.
So, as an investor, one trap you must avoid is having more exposure to the market’s decline and less exposure during the following rally. Limiting your declines allows your portfolio to take a larger position in equities during “kickback” rallies. As the market becomes overbought, after a rally, an adaptive portfolio can shift back to being more defensive. This is called “ratcheting” the portfolio by allowing market fluctuations and volatility to work for you, rather than against you.
Eventually, this bear market will end and a new bullish one will begin. When that occurs, a portfolio that has ratcheted through the bear market, will be in a better position to compound in the long-term. An adaptive portfolio should have less volatility than the markets and come off of a bigger base value during the market’s rallies.
Source Brandon Bischoff
The Week Ahead
The past two weeks have laid bare the brutal realities of rising rates, stubbornly high inflation, and a slowing economy. Investors are left to wonder when and where the pain will stop, as the S&P500 is on the verge of making new lows after recovering more than half its losses from earlier in the year, which would be a historic first occurrence. Although the economic calendar lacks the punch of recent weeks, there is plenty to keep an eye on in this elevated volatility environment. The Fed’s quiet period has ended, so there will be numerous appearances by FOMC members to scrutinize. Will they pour gasoline on the hawkish fire, or attempt to quell some of the negativity? The headline U.S. event will be the Core PCE Price Index on Friday, which has been declining since the 5.3% peak in February but is expected to tick back up from July’s 4.6% reading. Other U.S. releases include consumer confidence, durable goods orders, new and pending homes sales, personal spending figures, and trade updates. Overseas, the EU will issue its CPI flash estimate for September, anticipated to jump to another record high. Germany also publishes CPI data along with business and consumer confidence.
This article is provided by Gene Witt of FourStar Wealth Advisors, LLC (“FourStar” or the “Firm”) for general informational purposes only. This information is not considered to be an offer to buy or sell any securities or investments. Investing involves the risk of loss and investors should be prepared to bear potential losses. Investments should only be made after thorough review with your investment advisor, considering all factors including personal goals, needs and risk tolerance. FourStar is a SEC registered investment adviser that maintains a principal place of business in the State of Illinois. The Firm may only transact business in those states in which it is notice filed or qualifies for a corresponding exemption from such requirements. For information about FourStar’s registration status and business operations, please consult the Firm’s Form ADV disclosure documents, the most recent versions of which are available on the SEC’s Investment Adviser Public Disclosure website at www.adviserinfo.sec.gov/

