
Consequences of Bad Behavior & weekly Market Review
for the Week Ending Sept 30 2022

The content of this Newsletter is to provide you with Economic insights to assist you in making better decisions with your investments. Unlike many other financial periodicals we will not mention specific companies, unless it is relevant to an overall economic issue. We welcome your questions on economic concerns and will address in our newsletter. just email us at info@optfinancialstrategies.com #FinancialAdvisor,#investmentmanagement #wealthmanagement #financialplanning #retirementplanning #401kplans
The markets got beaten up again last week, which was also the end of the month and the 3rd Qtr. All four of the major indices were down with DOW and the S&P having the largest decline of -2.9% followed by the NASDAQ -2.69% and the Russell -.028%. But the numbers to focus on are the Monthly and the YTD return. Price declines for the month fanged between -8.8 DOW to -10.5% NASDAQ. The quarterly returns were slightly better due to the bear market rally in August. YTD we now have all indices at more than a negative -20% decline with the NASDAQ showing a -302.4% decline followed by the DOW and Russell 200. There are reasons for this, and we will discuss further in this newsletter.
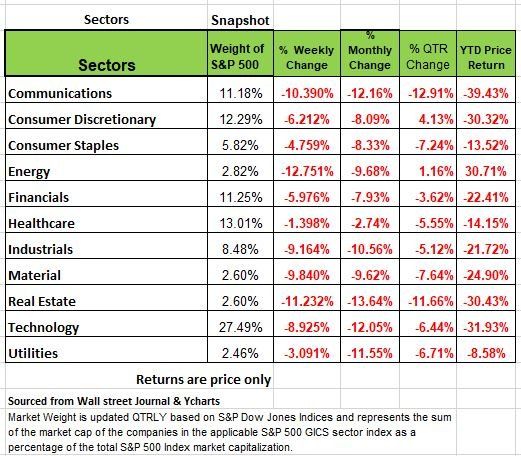
All 11 of the major S&P sectors were deep in the red last week with Healthcare and Utilities showing the smallest decline. The largest declines came in Communications, Energy and Real Estate.
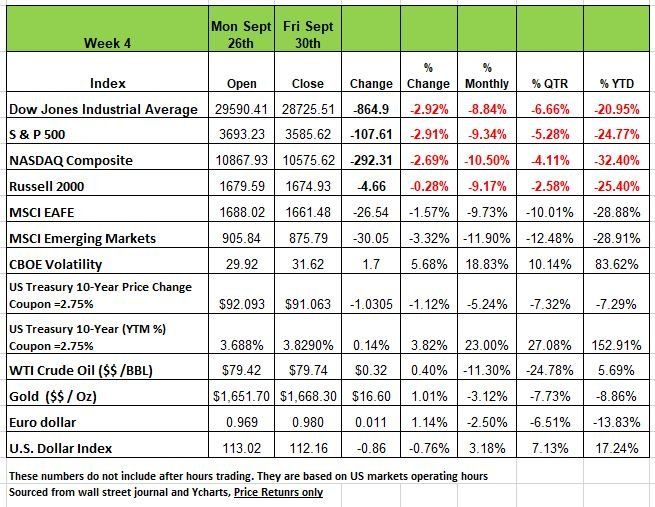
Treasury yields closed higher last week following another bout of market volatility. Early in the week, the new UK government’s stimulative tax cuts roiled financial markets. The price of the 30-year British bond collapsed by an unprecedented 24% and fears of a financial shock spread across the country before the BOE announced on Wednesday it would step in and buy long-dated bonds to restore calm. The move reverberated throughout global markets helping send U.S. yields sharply lower on Wednesday.
Throughout the week, several underwater leaks of the Nord Stream pipeline were documented with fingers pointing to Russia as the likely saboteur. On the effect of the leak on Western allies, former commissioner of the Federal Energy Regulatory Commission Neil Chatterjee says, “these leaks kill whatever hope there was that this pipeline could help get them through the winter.”
On Friday Vladimir Putin escalated the war once again by announcing the annexation of four regions in eastern and southern Ukraine.
Bad Behavior always has a consequence
Have you ever purchased a pair of cheap sunglasses at the drug store? Maybe you left them on the seat of your car and sat on them, left them somewhere and could not find them or forgot them somewhere but going back to get them was too much of a hassle because they were cheap, so you just got another pair. Replacing it was not a big deal and maybe it did not bother you too much if it was not too sunny outside. But if the sunglasses cost you a few hundred dollars, chances are you took better care of them. Maybe you had a nice case that they came in, you clean them and kept them in a safe place.
When there is an abundance of anything and the price of such an item is cheap, we tend to treat the product poorly. If it breaks, we’ll buy a new one, if we misplace it, we’ll get another one, if we lose it, not problem there’s plenty more where it came from. This is the way corporate America treated money over the last decade.
With interest rates having been so low for such a long time, investors were willing to take bigger bets knowing that all they needed was for one to hit it big. Innovative companies with great products and poor operations management were kept afloat way too long and they amassed way too much debt.
Very little is written about the growing debt problem, make no mistake debt is a growth killer!
Corporate cash flows are dwindling relative to their liabilities, leaving them little choice but to borrow to expand, postpone any expansion, or, for most, look for ways to cut costs. The latter means lowering labor costs either through shorter hours (the workweek has been contracting), a slower increase in pay/benefits, or directly through layoffs, which we expect to see as the Recession unfolds.
The recent Citrix fiasco is a particularly egregious example of a shift in corporate debt markets.
Back in January of this year bankers underwrote the leveraged buy-out of Citrix. Yield-hungry investors were desperate to get their hands on any meaningful return, which the $16.5bn Citrix deal promised. Lenders including Credit Suisse and Goldman Sachs were happy to dole out $15bn to finance the transaction. Inflation would pass, central bankers felt it was temporary. Russia had not yet invaded Ukraine; energy markets stable and the world’s economies were rebounding from the pandemic. How quickly things can change. Now nearly 10 months later the banks are trying to offload the debt in a market overwhelmed with stubborn inflation, war, and a world recession. Banks are struggling to find buyers of their debt, they dumped $8.6bn of the debt at a discount, incurring a $600m loss. That’s a lot of money. They are still pondering the remaining $6.4bn on their balance-sheets and how much more they can write down is yet to be seen.
With western central banks pushing interest rates to their highest levels in 15 years and shrinking their balance sheets at the same time, more poorly run companies are beginning to struggle. Those that bought corporate bonds during the pandemic to stave off a wave of bankruptcies have been selling them or have already done so. All this is draining the market of liquidity as investors abandon riskier assets like corporate debt in favor of safer Treasury bonds now that these suddenly promise decent return. The result is plummeting prices of corporate bonds, especially for less creditworthy businesses, yields on junk paper have soared to 9.1% in America and 7.5% in Europe, up from 4.4% and 2.8%, respectively, at the beginning of the year
All this raises the question about what happens next with the mountain of debt that companies have amassed in recent years. In the last 22 years non-financial corporate debt has gone from 64% of GDP to 81% in America and from 73% to 110% in the Europe. Britain has maintained the same level since 2000. American, British, and European public companies now owe creditors almost $19trn, with a further $17trn owed by private companies. So, the question to ask yourself is, just how unstable is this pile of debt?
The credit crunch will not affect all borrowers equally. Some companies like Apple have more cash than one can deploy. But most companies are not as fortunate. We think that the increase in borrowing cost will cause a significant strain in 3 sections.
The first group, are those companies that have poor balance sheets that have operated their companies in the past with cheap debt, used to either buy back shares or to spend money on just keeping the company afloat. This can be seen in the less orthodox sources of credit provided by non-bank lenders, private credit has grown dramatically with these types of loans tend to tolerate high leverage as they are often bundled and sold off, much like the bad debt of home loans in 2008. The challenge for these borrowers is that they are exposed to floating interest rate loans, borrowers are far more exposed to rate rises. Because this sort of debt often comes with fewer strings attached, lenders have limited ability to accelerate repayment once signs of distress emerge.
The second group of vulnerability involves the zombie companies, we have spoken about them in the past, uncompetitive enterprises, kept alive by cheap debt and, during the pandemic, government bailouts. We define a zombie company as one that is ten years or older and whose interest coverage can barely be covered for at least three consecutive years, many fast-growing but loss-making tech firms, in sectors like biotechnology, where products take years to get to market,
On that definition, there are more than 443 active zombies that are listed in America & Europe, but represents about 5.6% of all listed firms, and hold 1.9% of total debt and 1.4% of total sales. Their demise would be a benefit unless you are an employee or owner of their stock
The last and biggest group of concern are firms that are merely unfit. One way of capturing their pervasiveness is to look at firms with an interest coverage ratio of less than two times.
These companies account for a fifth of the total debt of listed American and European companies some $4trn-worth. These companies have debts that are rated just above junk status. Some 58% of the investment-grade non-financial corporate bond market is now rated BBB, according to Fitch, a ratings agency. The average yield on such bonds has more than doubled in America in the past 12 months, to 5.6%. Unlike high-yield bonds, many of them come due soon and will need to be refinanced at much higher rates.
Since the global financial crisis and central banks holding down interest rates, plenty of mature companies with slow sales growth have taken advantage of cheap credit to pile on debt to the point of junk status, just to fund shareholder payouts. As profits come under pressure and interest costs rise, they face a squeeze that would lead them to cut employment and investments. The concern here is the downward spiral as unemployment rises consumers will have less to spend on anything more than the essentials. Bad behavior must have a consequence, it can only be pushed off for so long. The longer it takes to realize the consequence the more painful it will be. We are not predicting a financial armageddon but stating that if your investments are not based on sound fundamentals and your portfolio is on auto pilot, part of a passive strategy that had low expenses, chances are you will see bigger losses in the short term and will spend more time trying to get back to break even. Reference Source https://www.economist.com/business/2022/09/27/a-reckoning-has-begun-for-corporate-debt-monsters
A Technical Perspective
For those new readers to our newsletter technical analysis is an investment strategy /trading discipline that relies on identifying opportunities by analyzing statistical trends gathered from trading activity, such as price movement and volume. While no one can identify the bottom and peak price of a security, technical analysis tries to identify opportunities close to it.
In just the last few weeks, we have seen a broad-based sell off fueled by investor pessimism. The big question for investors moving forward should not be “what will the markets do next?” and instead should be “what is my plan for dealing with it?”
Portfolio management is a lifetime endeavor, and not an endeavor that is won or lost in the short-term. Success in the long-term requires a series of good short-term decisions. For the first time since the financial crisis, we are in a bear market. To deal with a bear market requires several short-term decisions that align with a plan to achieve a long-term benefit. We know that we are currently in an extremely difficult market.
Now that we are through the first 9 months of 2022, most investors should be reminded of how a real bear market feels. Year to date, the S&P 500 is down -24%, the Nasdaq is down -32.5%, and the 20-Year Treasury bond is down -29%. The current market environment cannot be confused with a rare “trading anomaly” like we saw at the beginning of the covid crisis in 2020.
In 2020, we saw an example of a “mega trading anomaly.” The S&P 500 dropped -32% over just 23 trading days. The market then rallied back to breakeven just 5 months later.
The current bear market is a long-drawn-out affair and this bear is showing no signs of ending anytime soon.
The Markets this Year
We have outlined bullet points detailing various facts about the bear market we have seen in 2022.
- The second quarter ended as the market came off its June low. From mid-June through mid-August, the S&P 500 rallied +17% in just 2 months. At the time, the market index was still -10% from its hold high.
- The theme for 2022 has been market fluctuations. After rallying +17%, the index closed the quarter by declining -17% from its August high. In a period of 3.5 months, the market rallied +17% and then declined -17%. That is a ton of volatility.
- In just the month of September, the S&P 500 fell -9.3%. That is the worst September monthly return since 2002. September alone had 8 “outlier days” (a trading day beyond +/-1.50%). In a normal, bull market year, one would expect the market to have about 13 total outlier days. Index Investors have almost experienced a year’s worth of volatility in single a month.
- September’s decline was broadly felt. Even the most “defensive” sectors like Consumer Staples, Energy, and Utilities felt the impact of market volatility.
- There have been 62 “outlier days” in 2022—more than 4.5 years-worth of outliers.
- The real issue for many conservative investors has not been the markets. We know that markets will fluctuate. The real issue has been bonds. Just in September, long-term treasuries were down -8%, bringing their decline in 2022 to -29%, and -40% from their 2020 peak.
- A balanced allocation of 60% stock and 40% bonds would be down about -22% on the year. In other words, the “conservative” asset has not done anything to offset portfolio risk.
The Anatomy of a Bear Market
Bear markets, are characterized by having large, momentous, short-term fluctuations. Markets are counterintuitive in that they tend to do the opposite of what you would least expect, when you would least expect it. Markets will tend to bottom out and go up long before the economic news begins to get any better. Markets will go up when pessimism is at high and go down when investors get a little too optimistic. Its irrational
The market has seen several, emotional swings, both up a down. During every one of these swings, investors have felt a different emotion, which coincides with the market’s current short-term trend. The chart below shows investor sentiment, at each market peak and trough during 2022. Investors have felt more bearish at the troughs prior to a rebound, and less bearish as the S&P 500 has gone higher and put in a relative peak. The data is pulled from the American Association of Individual Investors.
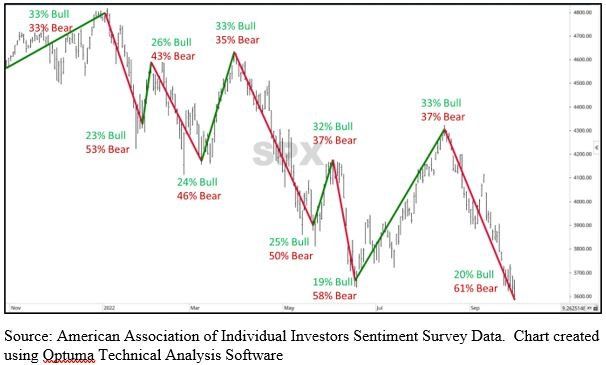
Bear markets will establish a chart pattern of lower lows and lower highs. Bear markets will also have large short-term fluctuations because of the actions of anxious and unsure investors. Therefore, bear markets will be more volatile and are more likely to have sharp parabolic declines followed by equally sharp short-term advances. This has been seen repeatedly in 2022. Right now, pessimism is at its high for the year. According to that investor sentiment survey, this is one the highest levels of pessimism we have ever seen in the markets. That is not to say that the market will take off and rally, but it certainly does increase the probability of a short-term rally. The extent and timing of the rally are unknown variables, but when pessimism is at a high, it puts the market in a position to do the opposite of what most would expect.
There are only two certainties about bear markets. One is that they will be volatile, and full of both sharp declines and large advances. Remember, the largest market rallies have occurred in the middle of some of the worst bear markets. The other certainty is that there will eventually be a new bull market that follows. No one knows when that transition to a bull market will happen, nor do they know what the impact of the bear market will be, but all bear markets are eventually followed by a new bull market. So, the question is “how do you navigate a bear market and benefit from its large swings?”
Adaptive Portfolio Management
A good Advisors primary objective should be to manage a portfolio in a manner that will benefit from extended bear markets, like the one that we are currently experiencing in both the stock and bond markets.
An adaptive portfolio should adjust its diversification in a way to maintain what we call an “efficient portfolio”—or one that has consistent, low volatility through variable market environments. One way to measure consistent, low volatility is through a concept known as “outlier days.” An “outlier day” is any trading day that exceeds +/-1.50%. An outlier day statistically should occur once every twenty trading days, or thirteen times per year.
So far, in 2022, the market has experienced 62 outlier days (six times the expected amount to this point in the year). Although the metric is slightly different for bonds, twenty-year treasuries have experienced 46 days beyond +/-1.50%, and one balanced Vanguard 60% stock/40% bond mutual fund has experienced 21 outlier days.
Our Portfolio Thermostat has experienced 8 outlier days this year, which is what you expect to experience in a normal market environment with limited volatility. This does not mean you will not experience unrealized losses, but will minimize them.
Even with that limited volatility, it takes more than limiting outlier days to benefit from a bear market. An adaptive portfolio needs to limit declines, but also participate in the sharp bear market rallies that are common, and expected, in today’s market environment.
No one can identify the bottom so an adaptive portfolio will increase its exposure to market equities during the declines, to best participate in the rallies that soon follow. Try to keep emotions to a minimum fear is an indicator that you’re not acting rationally. You will see portfolio declines when markets are on the downswing. But this is required to take advantage of the rebound. Source Brandon Bischoff Canterbury
The Week Ahead
We are wondering if the Fed can continue with its uber hawkish attitude toward inflation as the steady rise in interest rates are causing problems throughout the world. Europe is dealing not just with energy issues from Russia but a decline in the Euro dollar. In addition, we are seeing an erosion in asset prices. In addition to the Fed, we expect to see monthly U.S. employment data. Estimates are pointing towards around 250K jobs added for September, and the JOLTS report is expected to show over 11M openings still available. We are not too confident in the predictions Tuesday will feature U.S. ISM PMIs and factory orders, which are expected to turn positive in August. Overseas, the week kicks off with Australia’s central bank decision on interest rates. The RBA is anticipated to deliver a fifth straight 50bps hike even as the housing market shows signs of slowing. On Wednesday, OPEC+ meets as the organization considers lowering production by up to 1 million barrels per day to support prices. Crude oil has closed below $80 for two consecutive weeks. In Europe, final PMIs will be updated along with producer prices and retail sales for the region, while Germany’s factory orders and industrial production numbers will shed light on how the energy crisis is impacting manufacturing
This article is provided by Gene Witt of FourStar Wealth Advisors, LLC (“FourStar” or the “Firm”) for general informational purposes only. This information is not considered to be an offer to buy or sell any securities or investments. Investing involves the risk of loss and investors should be prepared to bear potential losses. Investments should only be made after thorough review with your investment advisor, considering all factors including personal goals, needs and risk tolerance. FourStar is a SEC registered investment adviser that maintains a principal place of business in the State of Illinois. The Firm may only transact business in those states in which it is notice filed or qualifies for a corresponding exemption from such requirements. For information about FourStar’s registration status and business operations, please consult the Firm’s Form ADV disclosure documents, the most recent versions of which are available on the SEC’s Investment Adviser Public Disclosure website at www.adviserinfo.sec.gov/
The Optimized Investor
