
Inflation, Earning Season & Other Economic News
for the
Week Ending July 9th 2021

The shorten holiday week, produced some mixed results. The S&P500 and Dow Jones Industrial Average eked out modest gains, lifting the S&P500 index to a new all-time high. The Nasdaq- faired a bit better, advancing 0.42% on the heels of investors favoring growth over value, while the Russell 2000 lost -1.12%. Friday’s impressive rebound in the Small caps index managed to recoup much of the 4.5% loss from Thursday low.
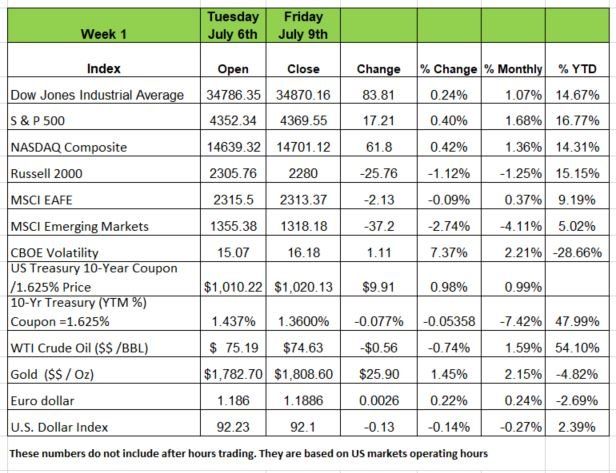
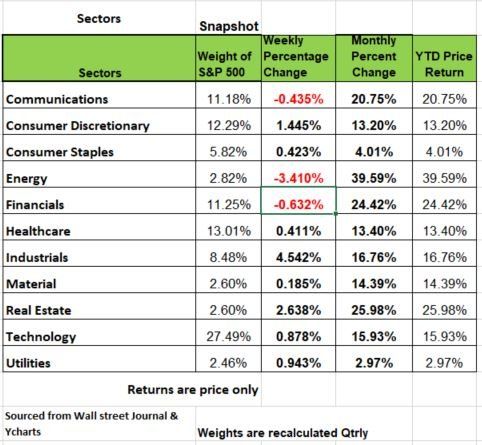
All 11 major sectors were up on a priced based return basis for the year. The top-performer was Energy, up 39.59%, while the worst showing came from Utilities, up 2.97%. YTD. Last week only 3 sectors were in the red with energy having the largest decline 3.41%. Uneven economic data kept pressure on rates as the yield on the 10-year T-Bill fell as low as 1.25% before ending the week period at 1.36%. The 30-year Treasury closed the week below 2.0%.
Cutting Through some of the Noise
Keep in mind we are in a very interest sensitive environment. The yield on the benchmark 10-year Treasury closed trading on 6/30/21 at 1.47%, down 13 basis points (bps) from its 1.60% close on 5/31/21 and 23 bps from its high of 1.7% on May 13, 2021. Bond investors continue to embrace higher levels of risk to secure higher yielding fixed-income securities. The yields on U.S. high yield corporate bonds, aka junk bonds, hit an all-time low of 3.78% on 6/29/21, according to Bloomberg. In June, Moody's reported that its global speculative-grade default rate stood at 4.9% in May, the historical average default rate at 4.2%.
While FOMC officials discussed the idea of tapering their bond purchases, most members agreed that patience in assessing the ongoing recovery was most prudent. The U.S. Services PMI slipped from May’s record number but still came it at a respectable, expansionary 60.1 level. Crude oil prices dropped early in the week but quickly bounced back after the weekly inventories report registered a 6.9M barrel draw with gasoline inventories down by 6.1M.
Jobless claims rose to 373K, while last week’s number was revised up to 371K, further fueling Thursday’s volatility. But more importantly continuous claims are holding steady above the 14MM number. These are not the numbers that support a healthy Economic recovery. We believe that the true health of America’s economy will be seen at the end of September after the governments weekly allowance stops
Lastly, in the Far East, the People’s Bank of China slashed the reserve requirement ratio by 50 basis points in an effort to shore up liquidity for the stalling economic recovery.
Are Markets Over valued
Many are convinced that a stock market correction, is inevitable. The S&P 500 was down 1.6% last Thursday, then rebounded and hit a new all-time high on Friday. Last year all indices ended the year with record breaking numbers. Think about it, the economy came to a halt, supply chains were interrupted and are still not back to healthy levels. We have over 14 mm unemployed people and employers cannot find enough help.
What does all this mean? Well for one the volatility is a sign that confidence is low. Traders are looking at the short term rather than the long term. Many agree that what the government is doing is creating long term problems for the future. But money has to go somewhere and with interest rates so low and the question of inflation still being debated over whether or not it is transitory or systemic, investors are taking gains where it can.
Right now, the Fed is artificially holding interest rates down across the yield curve. So, when analysist calculate their estimate of fair value of future cash flows discounted to present value, they are using a low interest rate number bringing the value higher. So, what happens when the Fed raises rates? Those values change and the markets react. Remember 2018 when the Fed raised rates? The markets did not like that and we had a very volatile year with a significant decline in values by year end
We feel that the current monetary policy is inflationary, and that past government spending, has lifted US Federal debt above 100% of GDP. While the strength of the U.S dollar is still strong and considered the world’s currency a drop in the DXY (dollar index) could be a telltale sign of a very bad economic future.
Earning Season for Q2 is here
The second-quarter 2021 earnings season kicks off this week with reports from the major banks. They are usually the first to give signs of economic health, but keep in mind that all the major banks are flush with cash. Last month’s stress testing showed that banks have more cash than ever since the institution of the stress test mechanism after the 2008 crisis. The amount of cash kept in the banking system means its not going out to businesses. One could interpret this as a lack of confidence in the economy. In addition, an unusual phenomenon has been created the reverse repo, where by banks are no lending money back to the government on an overnight rate of 5 bps.
We expect that most of the earning will be positive, probably be better than expected but the real tell-tale sign will be Q3 and Q4
Stocks have hit records in recent weeks despite a variety of headwinds. Now, the tailwinds of the nascent earnings season could be a catalyst for even more gains.
In the past month, the S&P 500 has charged up 3% and hit several all-time highs, pushing through
after a surge in activity spurred by reopening and trillions of dollars of fiscal stimulus.
The Stock Market Can Continue to Grow—Even If It Isn’t as Impressive
Though it might seem like little happened to the stock market last week, the S&P 500 had to overcome some obstacles on the way to a record high
Inflation still going strong
Consumer prices continued to surge in June, rising at the fastest pace since August 2008 and raising more questions over whether price inflation will be transitory.
Hot inflation readings over the last few months have largely been attributed to the so-called base effect, depressed pandemic levels from a year ago translate to artificially higher year-over-year rates.
But that explanation does work so well for June. While the base effect hasn’t entirely faded, it is diminishing. Back in June 2020, monthly inflation numbers bounced from negative levels were associated with shutdowns, so this means that Tuesday’s CPI reading is the first since inflation started surging, not the same argument working here. But supply chains are still not back pre-pandemic levels.
With person income still higher due to Government allowances, demand is still high. In addition, business may be trying to recoup some of their losses from the shutdown. We think we still need to wait a few more months to see if prices level off. Source: https://www.wsj.com/articles/us-inflation-consumer-price-index-june-2021-11626125947?mod=hp_lead_pos1
Consumer borrowing is back
Outstanding consumer credit shot up at a 10.0% annual rate in May, the most since March 2016. After a period of lull during the pandemic, when lockdowns suppressed consumer spending and part of the stimulus money to households went toward debt paydown, revolving credit (mostly credit card debt) increased at an 11.4% annual rate in May. This is no surprise as the hospitality & leisure sector benefits most from this increase. People are dinning out more and traveling so we expect this sector to continue for a while.
Nonrevolving credit climbed at a 9.5% annual rate, the most since September 2015.That is also no surprise as homes loans and auto loans account for a large part of this number.
The resumption of faster credit growth reflects the reopening of the economy and easy credit conditions. Some people look at this as a signal of growing consumer confidence in the post-pandemic recovery. But it can also be the result of government “helicopter money” and the time of year, summer, so more people are getting out of their homes and lastly banks need to make money on credit cards which generally carry a higher interest rate than other loans. Source: https://www.wsj.com/articles/borrowing-is-back-as-sign-ups-for-auto-loans-credit-cards-hit-records-11625736601
If you know what you’re doing you can make a lot of money
A Little-Known ‘Back Door’ Trick for Boosting Your Roth Contributions
Last week a lot of noise was heard about how investor Peter Thiel, who has over $5 Billion in his Roth IRA account. Meaning he does not have to pay tax on that money. However, he may have paid taxes prior to transferring the assets into that account. While most of us do not have the luxury of sticking shares of a high-priced company we own in a Roth account we do have some options.
First a Roth IRA is a retirement savings account that allows you to invest after tax money into the market and grow tax free. When you withdraw the money, you will not have a tax consequence like you would with a tax deferred account. Many 401K plans allow this vehicle to be place in their plans. But if you are making a lot of money and need to lower your tax liability you probably want to take advantage of the tax savings. In addition, if your company has a match that will go into a separate tax deferred account.
But the best way to make this work if you qualify is to open a separate Roth account The max contribution is $7,000 if over 50 years old and $6,000 if under 50. In addition, you AGI (adjust Gross Income) needs to be below $125K /year. If you have the investing acumen you can purchase specific stocks and allow the value and dividends to accumulate tax free. If you’re not comfortable picking specific companies, perhaps a good Investment advisor can help. When you withdraw the money, you will not have to pay tax on it. Source: https://www.wsj.com/articles/a-little-known-back-door-trick-for-boosting-your-roth-contributions-11625848733
The Week Ahead
Fed Chair Powell’s testimony to the Senate Banking Committee this week will be closely scrutinized by asset managers. Front-end Eurodollar yields fell 20-30 basis points after the release of the FOMC minutes last week, implying significantly less tightening of policy in 2023-2024, so interest rate traders remain on high alert for further monetary policy clues.
Ahead of the testimony, the U.S. Treasury will auction 10- and 30-year government paper, and given the backup in yields of late, strong auctions are expected.
On Wednesday, the Bank of Canada will release its monetary policy report. On the inflation front, both U.S. and European CPI and PPI emerge, offering the latest gauge on price pressures. With growth potentially stalling and inflation percolating, be on alert for stagflation chatter if the numbers run hot. Unemployment claims for the U.S. will hit Thursday and so will updated unemployment rates for the U.K., Australia, and China throughout the week.
Capping off a busy week for economic data will be Friday’s U.S. Retail sales. Consumption is the lifeblood of the American economy, so Friday’s report may create some interesting price action in the weekend.
This article is provided by Gene Witt of FourStar Wealth Advisors, LLC (“FourStar” or the “Firm”) for general informational purposes only. This information is not considered to be an offer to buy or sell any securities or investments. Investing involves the risk of loss and investors should be prepared to bear potential losses. Investments should only be made after thorough review with your investment advisor, considering all factors including personal goals, needs and risk tolerance. FourStar is a SEC registered investment adviser that maintains a principal place of business in the State of Illinois. The Firm may only transact business in those states in which it is notice filed or qualifies for a corresponding exemption from such requirements. For information about FourStar’s registration status and business operations, please consult the Firm’s Form ADV disclosure documents, the most recent versions of which are available on the SEC’s Investment Adviser Public Disclosure website at www.adviserinfo.sec.gov/
The Optimized Investor