
Market and Economic Overview
July 4th, 2023

The content of this Newsletter is to provide you with Economic insights to assist you in making better decisions with your investments. Unlike many other financial periodicals we will not mention specific companies, unless it is relevant to an overall economic issue. We welcome your questions on economic concerns and will address in our newsletter. just email us at info@optfinancialstrategies.com #FinancialAdvisor,#investmentmanagement #wealthmanagement #financialplanning #retirementplanning #401kplans
Week In Review
Last week marked the end of the month, the 2nd quarter of the year as well as the halfway point of 2023.
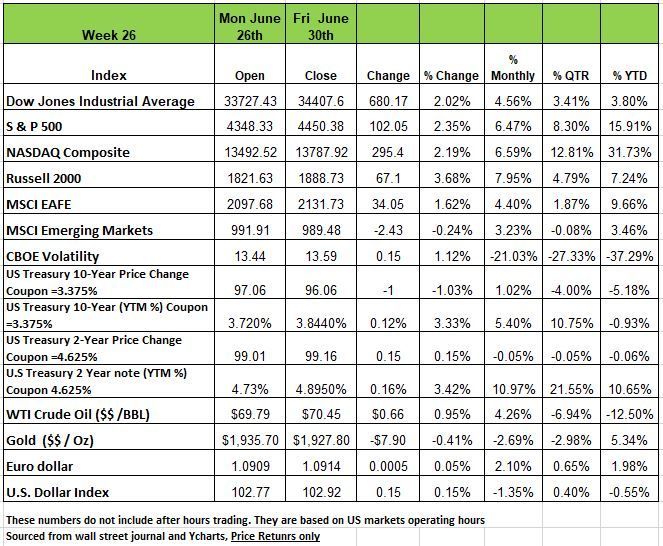
As you can see from the chart below the markets end strong with Russell 2000 ending the week up +3.68% followed by the S&P 500 +2.35%, the NASDAQ +2.19% and the DOW with +2.02%. On a YTD basis NASDAQ is leading the pack with a +31.73% price return followed by the S&P +15.19%. This is giving some investors motivation to jump back into the market with such high valuations and a fear of missing out (FOMO). However, it is worth noting that this upward trend is not a guarantee that the markets will continue to maintain this rally for the 2nd half of the year.
Treasury yields were up across the board, particularly in the 1–10-year range, after a batch of strong economic data supported the case for more rate hikes. Markets are now pricing in an 86.8% probability of another 25-basis point rate hike on July 26, which is the Fed next meeting. This would bring the Federal Funds rate to a range of 5.25% - 5.50%. Federal Reserve Chairman Jerome Powell remarked on last Wednesday that “although policy is restrictive, it may not be restrictive enough and it has not been restrictive for long enough” and that he “wouldn’t take moving at consecutive meetings off the table”.
The Fed recently reported that the M2 measure of money supply increased 0.6% in May, the first increase in 10 months. M2 (the U.S. Federal Reserve's estimate of the total money supply including all of the cash people have on hand plus all of the money deposited in checking accounts, savings accounts, and other short-term saving vehicles such as certificates of deposit (CDs) still remains down 4.0% from a year ago and is down at a 4.9% on an annual rate from the peak in July 2022. This number is often used to measure the impact of money in the system that impacts inflation.
New single-family home sales continued to recover in May, increasing 12.2%. Sales still remain well below the pandemic highs of 2020 as the main issue with the U.S. housing market has been declining affordability. Since the Federal Reserve began its current tightening cycle in March 2022, monthly payments have increased 21% and 30-year mortgage rates are currently sitting near 7.0%. Real GDP growth in Q1 was revised higher to a 2.0% annual rate from a prior estimate of 1.3%, beating the consensus expected 1.4%. The final reading for real GDP growth in the first quarter ended up being much better than expected as a result of an upward revision to net exports.
Once again, the S&P 500 index rose +2.3% this week, boosting the market benchmark's June increase to +6.5% as investors were encouraged by data showing stronger-than-expected US economic growth and lower-than-expected weekly jobless claims.
The gains came as economic data came in better than expected while the country's largest banks passed the Federal Reserve's annual stress tests.
Among the stronger-than-expected data, the third estimate of Q1 gross domestic product showed real gross domestic product in the quarter rose at an annual rate of +2%, up from the prior growth estimate of +1.3% and above the Econoday consensus estimate for a +1.4% gain. Also, claims for jobless benefits in the US fell to the lowest level in four weeks, defying expectations for a slight increase in the number of people seeking unemployment benefits.
The Federal Reserve gave investors more good news, saying 23 of the country's largest banks passed the regulator's stress tests of lender strength in the face of a hypothetical economic recession.
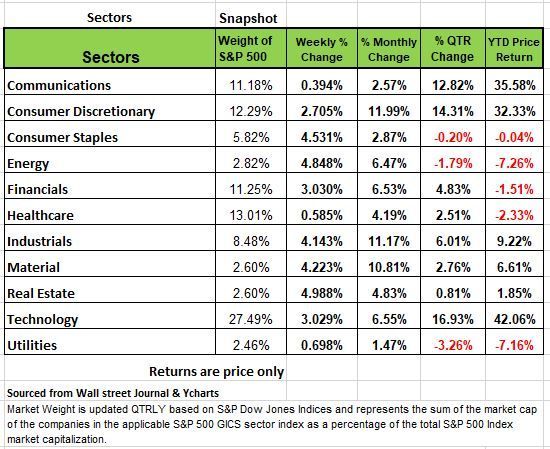
All of the S&P 500's sectors rose this week.
The real estate sector had the largest percentage increase, up +5%, followed by a +4.8% gain in energy, a +4% rise in materials and a +3.9% bump in industrials. Other sectors up by more than +2% included technology, financials, and consumer discretionary. Communication services eked out the smallest gain, rising +0.4%.
The energy sector's climb came as natural gas and crude futures also posted weekly gains. Gainers included shares of Targa Resources (TRGP), which rose 8.8%, and Halliburton (HAL), up 6.8%.
The small gain in communication services came as the sector was limited by a 2.2% drop in the shares of Alphabet (GOOGL) amid investment rating downgrades from analysts at Bernstein as well as UBS. Analysts at UBS, which downgraded the stock to neutral from buy, said the Google parent company faces limited upside growth and medium-term revenue risk.
Economy and the Markets
With the halfway point now behind us we thought it would be prudent to address the disconnect between the economic data and the markets behavior. The equity markets closed the quarter and the first half of the year on a high note with both the S&P and the NASDAQ indexes at interim highs.
The DJIA, is at 34,407 but is still -5.5% below all-time high (36,407) on January 5, 2022. Nevertheless, it has rallied nearly 20% from its September 30 ’22 low of 28,725. The S&P 500 closed on Friday at 4,450 and it has been on a tear for the past two weeks. However, it is still -7.2% below its 4,797 all-time high (January 3 ’22). Like the S&P, the Nasdaq, currently at 13,788, remains -10.3% below its 15,832 all-time-high (January 3,2022). And the Russell 2000 at 1888 is still -16.9 % from its Jan 2022 high of 2,272.
The reason for our sharing this information is that many investors tend to think this time is different and the streak will continue, especially with the media sensationalizing the information, so many see this as evidence that a new “bull market” has begun. Is it possible? It could be, no one has a crystal ball to see the future, and nothing has made much sense in market activity since the pandemic and all of the money thrown into the system. But we are skeptical and will share our reasons why.
Like the dot-com bubble at the turn of the century, the Nasdaq has been propelled by the current AI-craze (Artificial Intelligence). Since the S&P 500 is a capitalization weighted Index the top 10 stocks have driven most of this year’s movement, these companies account for 30% of the weight of the index. So, for instance both Apple and Microsoft are up over 40% with Nvidia up a whopping 189% on the year. The rest of the companies in the index have a wide range of mixed returns. There are than 200 members of the S&P that are posting negative returns on the year with the lowest being -53% (DISH). Another 100 companies are posting returns under 10%, most in the low single digits and the remainder of the companies account for approximately 2 tenths of a percentage of the weight of the index.
So, it is clear that a handful of large cap stocks (tech oriented) are responsible for most of the outsized performance, which is why both the DJIA and Russell 2000 have 2 lagged their tech laden benchmarks.
Historically the financial markets have been tied to the economy and its health. Eventually, equity prices will reflect what is going on in the economy. While there will be outliers, the current AI craze in the Nasdaq reminds us of the dot.com bubble 23 years ago. For those that entered the NASDAQ in early 2000 it took close to 15 years to get back to those high points. So, pending your age and how much of your assets are tied up in these index and ETF products, think twice about how you will feel if and when things reverse. Can you afford such a shift, and will you have to go back to work if you suffer too great a decline in portfolio value?
We have pointed out in the past that we see a growing weakness in the economy. Much of the past 3 years of economic performance came from “free money” programs and a moratorium on student loan debt payments. The former (“free money”) while in the rear-view mirror is still circulating the system, the latter (student debt moratorium) looks like it will end in September with the recent Supreme Court decision on the student loan forgiveness program. This means on average the younger working adult will have an additional $400/month payment. Perhaps the service industry will feel it most from this reduced spending. The challenge here for both investors and economist is that the U.S. has never thrown so much money into the system and provided so many people with income levels above their average earnings. So, we try to determine an outcome.
Lastly, most of the Q1 reports by companies either missed revenue marks or lowered earnings guidance for the remainder of 2023.
While reports today from TSLA stated that they exceeded production numbers, much of this was based on the drop in price for cars. What will Q2 show? The next few weeks may give us a clue to where things are heading for the second half of the year.
As we noted in past blogs, mortgage rates at 7% have made homeowners with current mortgages at 3% or lower so homeowners are not giving up their mortgages or trading up as the mortgage payment, even for a sideways move, would rise significantly and impact their lifestyle. For example, the payment on a $500,000 thirty-year fixed-rate 2.5% loan is about $1,975/month. That same $500,000 loan with a 7% rate jumps to $3,327/month, a 68% increase. $1,352/month ($16,224/year) is the difference, and it is substantial for most family budgets. For those families that are force to move or had adjustable mortgages that need to be reset this will impact spending in the coming months
The Fed’s favorite inflation index, the PCE (Personal Consumption Expenditure) Index showed a very mild +0.1% month over month increase in May (+1.2% annual rate) vs. +0.4% in April. On a year over year basis, the headline number here fell to +3.8%, the lowest reading since April ’21! Core Services Ex-Housing, a sub-index that Fed Chair Powell believes is quite important, showed up at +0.2% on a month over month basis in May (that’s a +2.4% annual rate). Still, from his recent testimony before the House and Senate, markets believe (80% probability) that the Fed will raise rates another +25 basis points (+0.25 percentage points) at its meeting in late July. All eyes will be on this month’s inflation number on July 12th.
The Commercial Real Estate (CRE) market is some $6 trillion in size. The Regional and Community Banks own four times the CRE debt that the larger banks hold. That’s about $2.4 trillion compared to $0.6 trillion at the large banks. We suspect a good portion of those banks wouldn’t pass the Fed’s Recession stress test. We’ve seen large hotel owners in San Francisco walk away from their loans (Hyatt at Union Square and Parc55), not to mentioned to owners of Westfield Centre Mall one of the largest malls in the city, and we understand that there are several more to come. Earlier in the year, we noted that some office buildings in NYC and LA had the same fate. The CRE issue is in its infancy.
Over the next two years, nearly half of U.S. public and private debt is set to mature and needs to be refinanced. This looks like it will occur with rates at least 300 basis points (3 percentage points) higher than the current rate. This will be a drain on cashflow for businesses and a strain on banks when their CRE portfolios turn to junk.
Last Friday, the Department of Commerce released its third (and final) Q1 GDP revision. According to the release, Q1 Real GDP rose at a +2.0% annual rate, up from the +1.3% in the last GDP update. Almost all the rise was due to an “improvement” in net exports, as without that “improvement,” real GDP growth would have been +1.4%. That “improvement” occurred because imports fell further and faster than exports. Ask yourself how strong the U.S. economy can be when imports are falling! It is clear from the monthly data that the early months of the year were stronger, and there has been a deterioration as the year has progressed.
Weekly earnings have barely kept up with inflation and workweek hours continue to fall as business owners cling to those hard-to-find workers, offering fewer hours instead of layoffs. Industrial Production in the U.S. has been stagnant for almost two years, and the Leading Economic Indicators (LEI) have been negative for the last 14 months. We are still amazed that the economy has weathered all these issues but with so many negative months in a row, its just as matter of time. Source Economist Bob Barone Ph'D
A Technical Perspective
For those new readers to our newsletter technical analysis is an investment strategy /trading discipline that relies on identifying opportunities by analyzing statistical trends gathered from trading activity, such as price movement and volume. While no one can identify the bottom and peak price of a security, technical analysis tries to identify opportunities close to it.
As a continued theme from the previous summary we take the technical perspective of the markets health. We believe that there are two potential issues that the markets are facing right now. We think that the markets are vulnerable and could become risky. The two issues that are going to discuss are
A few large names are masking market weakness.
Investor sentiment is at a high. That means investors are optimistic. This is a contrarian indicator.
For most of 2023, volatility has been declining from the high levels seen in 2022. Declining volatility is a positive for the markets. We know that volatility can be too high, but it can also get too low, which is where we seem to be now.
We have often discussed “outlier days.” An outlier day is any trading day that is beyond +/-1.50%. In short, we arrive at this “1.50%” threshold by examining the market’s daily standard deviation during a normal, efficient “bull” market environment. During normal market environments, you can expect that the S&P 500 would experience roughly 5 out of a 100, or 10-20 outlier days over the course of a year (250 trading days).
The market’s last outlier day occurred 33 trading days ago. This has been the S&P 500’s longest streak without an outlier day since September 2021. When volatility gets too low, it can be similar to the squeezing down of a spring- eventually the market will need to relieve some pent-up pressure. The release of pressure can occur in either direction which will most likely come in the form of “outlier days.” This combined with a very low volatile environment puts the market in a vulnerable position that could lead to a selloff, especially when you take economic conditions into consideration.
Market Breadth
When we address market breadth, we are speaking of the number of stocks that are doing well across the market (S&P 500). Currently the market only has a few large stocks going up, and a lot more going down or moving sideways. Many indexes like the S&P 500 and Nasdaq 100 are capitalization weighted. This means that larger stocks, like Apple, Microsoft, Google, Amazon, etc. will have a greater impact on those index’s price value. So far this year, larger technology-oriented names have vastly outperformed the rest of the market’s components. So, a few of the market’s largest names and biggest components are masking the overall health of the market and how weak the rest of the market is becoming.
Look at the chart below, which shows the Advance-Decline Line. This line measures market breadth, or the number of stock issues increasing versus decreasing. While the market has trended higher over the last few months, market breadth has declined. This means that a few larger capitalized stocks, like the few mentioned above, are pulling the market higher, but the majority of individual securities are falling off.
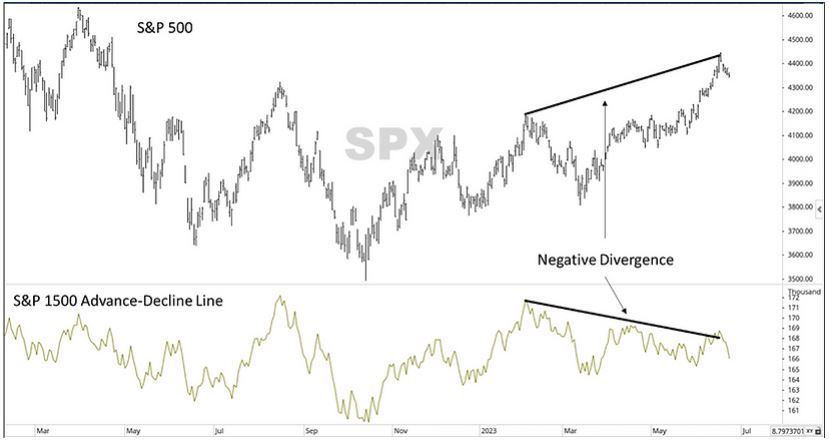
In 2022 Technology-related stocks were the worst performers. This year, they have been some of the best, to a point of over enthusiasm, especially with those related to AI. The danger is that parabolic curves can change quickly. With Tech’s overweighted impact on the market, and the rest of the market being generally weak, a decline in technology stocks could lead to an increased sell-off in the general markets. This will hurt investors especially those approaching or already in retirement that relay on selling off positions to generate income needs.
Market Sentiment
Over the course of the past few months, market sentiment has shifted from the majority of investors being bearish to the majority of investors being bullish. Colby Global Markets points out that CNN’s fear and greed index has floated between greed and extreme greed over the past few weeks and as the market has increased, underinvested portfolio managers have been forced into it to avoid the Fear of Missing Out. Historical evidence shows that high levels of optimism precede market declines, while high pessimism often precedes rallies.
So, investor sentiment is a contrarian indicator. The markets will often do the opposite of what the majority expect them to do. Supply and demand will experience periods of extremes. If everyone is bullish, then it means that everyone is already invested, and there aren’t many investors left to buy and push prices higher.
The sentiment indicator that we often look at comes from the American Association of Individual Investors Sentiment Survey. The survey is released weekly and gauges its participants’ opinions on where they think the market will be in the next six months. Participants indicate whether they are “bullish,” “bearish,” or “neutral” on the market.
In the June 15th survey results, bullish sentiment was at its highest level since November 2021. Bearish sentiment was at its lowest level since July of 2021, this is the most positive investors have been on the markets in almost two years. The last time the market was this “bullish” was right around the peak in the Nasdaq 100’s peak in 2021, prior to a bear market. As Warren Buffet has stated multiple times “be fearful when others are greedy and be greedy when everyone else is fearful” History will continue to repeat itself in that investors will buy at the peak and sell at the low which tends to lead to longer market rebounds times since losses are high. Source Brando Bischoff
The Week Ahead
Even with a shortened week in the U.S. due to the July 4th holiday, the economic calendar is packed. Domestically the focus turns to the employment picture. Last month’s strong jobs report prompted the Fed to lower its year-end unemployment rate forecast, and strength is expected in Friday’s number, with economists calling for 200K+.ADP private payrolls and JOLTS job openings precedes the government’s monthly report. FOMC meeting minutes are released Wednesday and may reveal details about the debate over future rate hikes. Investors will digest the survey based ISMPMIs, with manufacturing in today’s shortened session and services on Thursday. Overseas, OPEC hosts a conference Wednesday in Vienna that usually focuses on industry outlook, but policy surprises cannot be ruled out. The Reserve Bank of Australia meets later today coming off two consecutive unexpected quarter-point raises. Europe features a PPI release along with German manufacturing updates.
This article is provided by Gene Witt of FourStar Wealth Advisors, LLC (“FourStar” or the “Firm”) for general informational purposes only. This information is not considered to be an offer to buy or sell any securities or investments. Investing involves the risk of loss and investors should be prepared to bear potential losses. Investments should only be made after thorough review with your investment advisor, considering all factors including personal goals, needs and risk tolerance. FourStar is a SEC registered investment adviser that maintains a principal place of business in the State of Illinois. The Firm may only transact business in those states in which it is notice filed or qualifies for a corresponding exemption from such requirements. For information about FourStar’s registration status and business operations, please consult the Firm’s Form ADV disclosure documents, the most recent versions of which are available on the SEC’s Investment Adviser Public Disclosure website at www.adviserinfo.sec.gov/
The Optimized Investor
