
Are we close to the Edge?
Weekly Market Review for June 13th, 2023

The content of this Newsletter is to provide you with Economic insights to assist you in making better decisions with your investments. Unlike many other financial periodicals we will not mention specific companies, unless it is relevant to an overall economic issue. We welcome your questions on economic concerns and will address in our newsletter. just email us at info@optfinancialstrategies.com #FinancialAdvisor,#investmentmanagement #wealthmanagement #financialplanning #retirementplanning #401kplans
Week In Review
All four of the major indices were up for the week with the Russell 2000 posting the highest return of +1.9%, The DOW and the S&P 500 posted +.34% and +.39% respectively and the NASDAQ returned +.14%. The media made a point of saying that the S&P was now in a Bull Market territory since the low point in October of 2023. This may be giving the average investor false hope that the trend will continue. It is possible that the markets could continue on this upward trend but as you will read below some of the underlying economic data gives us caution. Economic data released last week showed the ISM Services Index handily missed expectations in May but remained in expansion territory, albeit at a slower pace. The slowdown was partly due to sluggish demand for service providers. Initial jobless claims for the week ending June 3 spiked to the highest level since October 2021, topping expectations. The increase was the largest in nearly two years. However, the volatility may be somewhat attributable to the Memorial Day holiday. This week, the Fed meets on Tuesday and Wednesday and is expected to pause its rate-hike campaign. The market has scaled back its expectations of interest rate cuts this year in recent weeks as the process of inflation returning to the Fed’s 2% target plays out more slowly than the market anticipated. The latest reading of the Consumer Price Index will be released on Tuesday, the day before the Fed’s decision on Wednesday.
Crude oil prices fell 2% despite Saudi Arabia unexpectedly announcing an additional production cut of 1M barrels per day.
U.S. Treasury yields rose modestly after central banks in Australia and Canada surprised with 25bps rate hikes, citing persistent inflation. At week’s end, the chance of a June FOMC rate increase was below 30% according to fed funds futures, but there is still a CPI release that could swing the outcome.
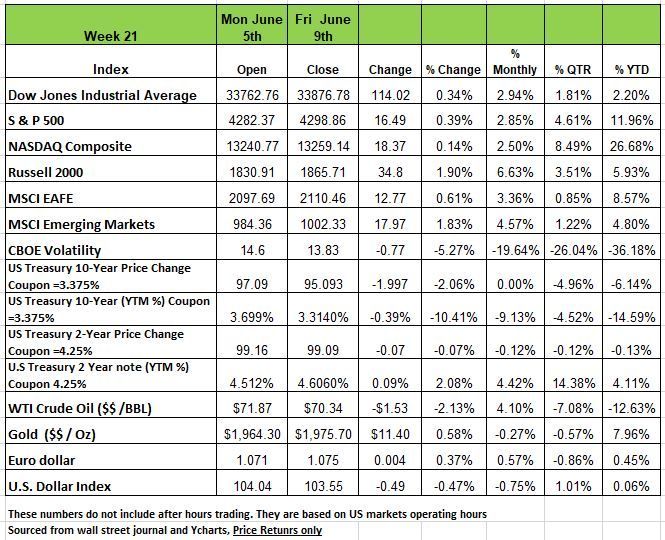
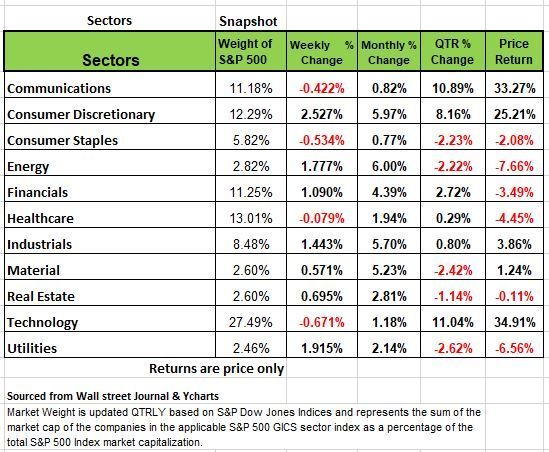
Seven sectors posted gains last week, all outperforming the headline index, while technology, consumer staples, communication services and health care posted losses.The World Bank and the Organization for Economic Co-operation and Development raised their global and US gross domestic product growth expectations for 2023. The OECD left its global GDP growth outlook for 2024 unchanged, while the World Bank downgraded its projections.
US economic data showed the international trade deficit widened in April to reach its largest level in six months, while weekly claims for jobless benefits jumped to the highest reading since October 2021, indicating a potentially softening labor market. The Institute for Supply Management's data showed a deceleration in services sector growth in May.
Consumer discretionary led the pack, up +2.4% on the week amid a 14% boost from Tesla (TSLA). General Motors (GM) will integrate the North American Charging Standard connector design, developed by Tesla, into its new electric vehicles starting in 2025.
Financials rose almost +1% for the week, with help from a rally in regional bank stocks amid hopes of a Fed pause.
The energy sector gained +1.7%, following a rally in oil prices after Saudi Arabia's weekend announcement it will reduce its July exports by one-million barrels per day, while OPEC+ will extend about 1.1-million barrels per day of cuts through 2024.
Consumer staples fell -0.5% week-on-week, as a gain in spirits and wine company Brown-Forman (BF.A, BF.B) from higher fiscal Q4 results only managed to partially offset an -11% plunge in the Campbell Soup (CPB) stock after the food and snack company issued a downbeat earnings guidance.
Technology saw the steepest decline for the week, down -0.7%. Apple (AAPL) introduced its $3,499 Vision Pro mixed-reality headset at its Worldwide Developers Conference during the week, garnering mixed reviews from analysts.
Communication services dropped -0.4%, despite an 18% surge in the Warner Bros. Discovery (WBD) stock after the company announced the departure of CNN Chief Executive and Chairman Chris Licht.
Health care ticked -0.1% lower despite a 2.9% rise in Biogen (BIIB). The US Food and Drug Administration's advisory panel said the drugmaker's Alzheimer's treatment Leqembi may be eligible for full approval despite concerns about brain hemorrhage from using blood thinners with the drug.
Industrials increased +1.4%, with United Rentals (URI) and Delta Air Lines (DAL) significantly outpacing the sector’s gain. Utilities jumped +1.9% for the week, while materials and real estate added +0.6% and +0.7%, respectively.
Are we on the edge?
Sometimes you have to use your gut instincts especially if an environment seems oddly similar to the past. The S&P closed on Friday (June 9) at the highest level since May 2022; and is considered in Bull Market territory since the low in Oct 2022. The question on those more conservative investors is why this is occurring with clear evidence that the economy is shrinking, and as some may argue already in a Recession territory. If we take a look at Q1 corporate earnings we can see that there has been a significant drop especially in the all-important Retail sector which is a proxy for consumer strength.
Keep in mind that consumption represents nearly 70% of GDP. Economists are all over the board on their view of the economy and a Recession occurring. Many Wall Street firms are changing their view of a Recession occurring even as incoming data continues to deteriorate. But as we have stated before their job is to collect assets, and no one wants to invest in a market that is expected to go down.
It is also something to note that that the market has not been a good barometer of economic conditions lately. We have been stating for months that economic data has been weak and that the markets continue to rise. So, there is truly a disconnect between the markets and the economy. So we are just going to look at some of the information that we have been seeing and maybe you can decide where your comfort level lies.
We have been scratching our heads all year long. Despite April’s +339K nonfarm payroll number, there continues to be significant contradictions when one looks closer at the details of these numbers. So, it makes sense to be skeptical. First, the +339K was juiced by +85K, a number simply added (not counted) by the Birth/Death model. This is used by the BLS because it does not survey small businesses, so they add a number to the monthly payroll report based on a long-term growth trend for America’s small businesses. No doubt, small business employment grows over time, but not every month, and not when the economy is fading. Eliminating the Birth/Death model add-on leaves the counted jobs at +254K – still a relatively strong number.
But something else does not make much sense: First, the ADP monthly survey said large businesses cut --106K jobs in May. Since ADP actually processes payrolls, we think that there is a good chance that their numbers are a more accurate reading of the employment scene. Then we have the sister survey to the payroll report, the Household Survey, this is taken at the same time (a telephone survey of households) and showed a fall in employment of -310K. Something just doesn’t make sense for the same month it’s a 180 degree opposite result!
What is unfortunate is that the media has ignored this. Historically, It is the Household Survey that is used to calculate the unemployment rate. Not only was there -310K difference in the count, but the labor force itself grew by +130K and the combination of the two raised the unemployment rate from 3.4% to 3.7%. Does this make sense to you?
The broader unemployment measure, referred to as U6, includes people working part-time but wanting full-time jobs and those not currently actively looking but would take a job if offered. That rate rose from 6.6%. to 6.7%
Challenger, Gray & Christmas, the leading company in outplacement services for companies is the leader in providing layoff data, they counted more than 80,000 layoffs in May 2023, that’s up +287% from a year earlier. Outside of the pandemic, this was the highest layoff number for any May since 2007.
In May the workweek fell from 30.4 hours to 30.3, this may not seem like a lot, but throughout the entire manufacturing sector, it does translate to reduced output. The workweek has been flat or down for four months in a row, a sign of economic weakness. Economist David Rosenberg likes to correlate this to actual jobs as a measure of employment, so his equivalent of hours worked translates to the loss of -140K jobs. This is a significant number.
While layoffs are high and rising, it appears that job openings are still positive. The rationale for this is that businesses are having a hard time finding quality labor and are still in hording mode when they were unable to find any labor during the pandemic. Keeping employees has been tough and finding them even tougher companies have had to tolerate bad behavior like people not showing up to work and lower productivity. So, companies just keep looking and we expect will be to let lower quality employees go once they find replacements or to just cut hours until the person leaves.
Last Thursday (June 8), there was a pop of +28K in Initial Unemployment Claims for the week ended June 3. This could be the beginning of some significant deterioration in the labor market, and we are just at the beginning of the up cycle in the unemployment rate.
So why are the equity markets still pushing new highs? Well one theory is that the mindset of the current investor has changed. They no longer invest over time we invest for the moment. Our attitude has changed significantly and with Zero expiration options having become extremely popular. (This is a product that is traded during the day and is driven by pure speculation). These products can drive the market in either direction very quickly. The other issue is impatience, in the age of fast-moving information investors are getting in and out of positions just based on the headlines. This would explain why the equity market is interpretating the non-farm payroll data with such optimism, investors don’t appear to be looking at the details, and if they did, it would become apparent that the employment report wasn’t in sync with a flourishing economy.
Rising foreclosures are always an ominous sign of economic danger. The most visible sign of stress in the economy is occurring in the Commercial Real Estate (CRE) market. This is particularly prevalent in the class B and C office buildings which continue to struggle with low occupancy because of the work-from-home trend. An article in WSJ (June 6) stated that over $1.5 Trillion yes that is correct trillion in commercial loans will be due over the next 36 months and that 35% of pooled securitized commercial mortgages due between April and December 2023. In addition, based on current interest rates and the properties’ incomes and values. much as 83% of outstanding securitized office loans won’t be able to refinance if interest rates stay at current levels. Lastly delinquencies rose from 2.7% to 4.02% in May. This is just one of the sectors that have suffered collateral damage from flooding the economy with trillions of dollars and rewarding people for being irresponsible.
This past week saw the owners of the Hilton Hotel on Union Square in San Francisco and the nearby Parc55 Hotel walk away from their mortgages. Those are the second and third this year in San Francisco (The Huntington Hotel was foreclosed earlier this year.). Seven more San Francisco hotel properties are in danger of mortgage default.
We know that San Francisco may have its own idiosyncratic issues, but office buildings in Los Angeles and New York have entered the foreclosure process. It is our opinion that the foreclosure issues are not going to be limited to these areas.
We know that regional and community banks are heavily exposed to the CRE sector. As commercial property values fall and foreclosures mount, even those CRE loans that don’t default will have to be written down and monies set aside to cover expected loan losses. So more added stress to the banking system
While CPI seems to be sticky in certain areas we see it on a downward trend.
Apartment rental indexes are all showing lower rents; this will soon have an impact on CPI. Unfortunately, rents are lagged 6-8 months in the CPI calculation, and they haven’t yet shown up. But they will soon!
Railway carloadings are off -16% from year earlier levels, the steepest decline since 2009, and cardboard shipments (needed to make those home deliveries!) are off -10%. Some have characterized this as a “freight recession,” but no matter what you call it, it says a lot about the state of the consumer.
Source Economist Bob Barone Ph’D
A Technical Perspective
For those new readers to our newsletter technical analysis is an investment strategy /trading discipline that relies on identifying opportunities by analyzing statistical trends gathered from trading activity, such as price movement and volume. While no one can identify the bottom and peak price of a security, technical analysis tries to identify opportunities close to it.
When someone speaks about the “market index,” they are most often addressing the S&P 500. There is usually an assumption of diversification for investors when they purchase an index fund such as SPX. Yes, there are equally weighted S&P indexes, but most are not. The S&P 500 is composed of 505 of the largest company stocks in the United States. No, it is not 500 exactly. However, indexes themselves were not developed to be diversified in a way to reduce risk nor were they meant to be used as efficient portfolios, like many advisors tell you.
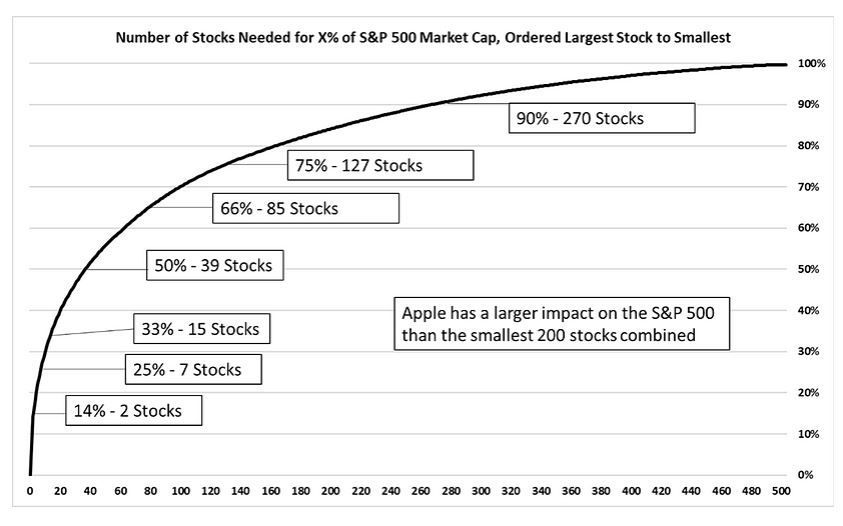
Most index funds, like the S&P 500, were created to measure market capitalization. Let’s take a look at how the S&P index is weighed right now, if you look closely at the chart you will see how the of the market is very distorted towards just a few very large names.
The S&P 500 is composed of a little more than 500 individual securities, but the index itself will move in the same direction as just a few very large stocks. Look at the chart below, which shows how many of the S&P 500’s components it would take to account for X% of the index’s market cap. Bottom line, it only takes 39 of the 505 stocks to get to 50% of the S&P 500’s market capitalization, and only 127 stocks to get to 75%.
Apple (the largest S&P 500 stock), is larger than the smallest 200 S&P 500 stocks combined!
Where does the market’s skewedness cause issues? Obviously, it causes an issue when technology stocks experience one direction movements, like the one seen in 2022. Last year technology stocks dragged the market down with it, while some more value-oriented sectors outperformed. On the other hand, the market’s heavy tilt towards technology stocks causes an issue when looking at the overall health of the market.
Right now, there are only two S&P sectors that have positive relative strength to the market index. Those two sectors are Information Technology and Communications, which combine for 36% of the S&P 500 capitalization. The other nine S&P 500 sectors are displaying falling relative strength, meaning they are underperforming the market on a relative basis.
When we take a look at the individual S&P 500 stocks, only a few are showing positive characteristics. If we take just the largest 150 US securities, they account for 78% of the S&P 500’s capitalization. The other 350 have little influence.
Using Market State Indicators (which measure a security’s risk level) as well as relative strength indicators, we composed a list of “buys,” “holds,” and “sells.” Out of the largest 150 S&P 500 securities, only 42 of them showed “buy” characteristics, while 81 were listed as “sells.” So, there is a small percentage of stocks, mostly technology-based, that are showing positive momentum, while several stocks are falling off.
The Week Ahead
Central banks headline a busy week, with rate decisions from the Federal Reserve, European Central Bank, and Bank of Japan. The Fed faces a difficult choice on Wednesday pending the CPI number released on Tuesday. Many think that the U.S. economy is in good shape by most indications, with consumer demand keeping core inflation elevated. Many committee members have been vocally dovish recently, seemingly in favor of skipping a hike given that the full impact of the past year’s tightening likely hasn’t been realized.
The rest of the U.S. calendar is loaded, with retail sales, producer prices, Treasury auctions, regional manufacturing updates, and consumer sentiment. In Europe, rate hikes are priced in for June and July, but the ECB may keep their options open beyond this month given the recent economic data. The BOJ meets Thursday and continues to predict that inflation will fall later this year. Judging by the yen’s YTD performance, markets are doubtful of any meaningful policy change. Finally, China releases retail sales and industrial production figures as the economy struggles with weak demand.
This article is provided by Gene Witt of FourStar Wealth Advisors, LLC (“FourStar” or the “Firm”) for general informational purposes only. This information is not considered to be an offer to buy or sell any securities or investments. Investing involves the risk of loss and investors should be prepared to bear potential losses. Investments should only be made after thorough review with your investment advisor, considering all factors including personal goals, needs and risk tolerance. FourStar is a SEC registered investment adviser that maintains a principal place of business in the State of Illinois. The Firm may only transact business in those states in which it is notice filed or qualifies for a corresponding exemption from such requirements. For information about FourStar’s registration status and business operations, please consult the Firm’s Form ADV disclosure documents, the most recent versions of which are available on the SEC’s Investment Adviser Public Disclosure website at www.adviserinfo.sec.gov/
The Optimized Investor
