
Market and Economic Review
for the Week Ending Oct 21 2022

The content of this Newsletter is to provide you with Economic insights to assist you in making better decisions with your investments. Unlike many other financial periodicals we will not mention specific companies, unless it is relevant to an overall economic issue. We welcome your questions on economic concerns and will address in our newsletter. just email us at info@optfinancialstrategies.com #FinancialAdvisor,#investmentmanagement #wealthmanagement #financialplanning #retirementplanning #401kplans
Week in Review
A big week of positive movement in the markets for the week ending Oct 21 2022. All of the major indices ended the week in positive territory with the NASDAQ showing the largest price gain of +5.22% followed by the DOW +4.89%, the S&P +4.74% and the Russell 200 with a +3.56% . All this positive upward movement as investors digested the latest round of Q3 earnings reports, many of which came in better than expected.
The S&P, which is the benchmark for the markets, ended Friday's session at 3,752.75, the weekly gain pushed the S&P 500 back into the black for the month to date price performance; it is now up 4.7% for October. However, the index is still solidly in the red for the year to date with a drop of 21% for 2022 thus far.
This week's advance came as more quarterly earnings rolled in above analysts' mean estimates. While companies are noting challenges such as inflation and supply chain issues, many are showing that they have still managed to surpass Street consensus estimates.
This provided a relief rally after stocks had been sliding in the weeks heading into earnings on worries about the impact of macroeconomic issues including inflation.
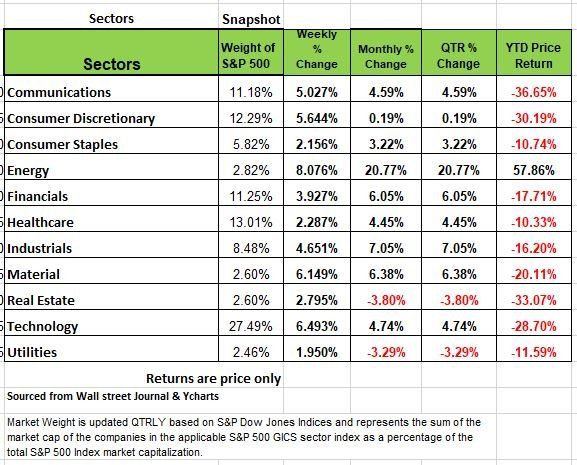
All of the S&P 500's 11 sectors rose this week, led by a 8.1% jump in energy, a 6.5% climb in technology and a 6.1% rise in materials. Other strong gainers included consumer discretionary, up 5.6%, and communication services, up 5%. The smallest advance was logged by utilities, which edged up 1.9%.
Economic data will include readings earlier in the week on the manufacturing and services sectors for October as well as the October consumer confidence index. However, more attention will likely be placed on the first estimate of Q3 gross domestic product on Thursday and September inflation data due Friday.
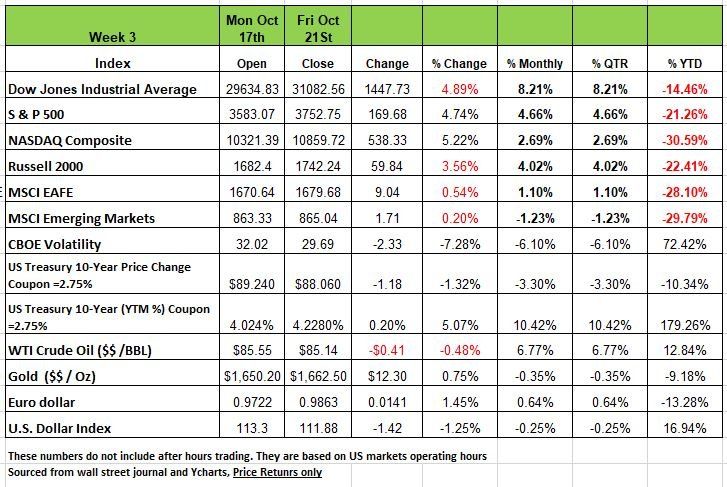
Treasury yields increased last week, with the benchmark US 10-year Treasury yield reaching its highest level since the financial crisis. UK Prime Minister Liz Truss resigned last week after her plan to cut taxes and increase spending sparked a chaotic ripple effect through the UK financial system. Last Monday, before her resignation, the new UK Treasury Chief announced a near-complete reversal of the proposed tax cuts. The reversal, combined with prior interventions by the Bank of England, helped stabilize markets and reversed a sharp recent increase in UK government bond yields. In the US, initial jobless claims unexpectedly fell last week as the labor market remains tight. US manufacturing output increased more than expected in September and notched its third straight monthly gain. The factory production gain was broad across industry groups. The Fed remains on track to raise interest rates by 0.75% following its next meeting on November 2
Economic Climate
This week we are expecting the release of Q3 GDP numbers. Most are expecting are expecting this number to be positive by more than 2%. If the numbers come in this high expect the markets to react positively.
GDP Indicates economic health. If the economy is growing more rapidly or more slowly compared to other quarters or past years. This signals to the Fed whether the economy should be restrained or
stimulated. GDP also determines which sectors of the economy are growing and which ones are declining. This information is also useful to investors and jobseekers. It also compares the size and growth rate of economies in countries throughout the world. This provides information on global investment opportunities.
So, what are the reasons for the increase and does this mean we are in a good place economically? Well, the first thing is to evaluate the formula for GDP. This includes Consumer Spending (C ) + Investments made by Industry (I) + Governments Spending (G) + Net Exports (NE). For those unfamiliar with net exports, it is the difference between import dollars and export dollars. So, we know that consumer spending has decreased but inflation has added to the total dollars in consumer spending this becomes the difference between Real GDP actual dollars spent vs Nominal GDP dollars adjusted for inflation. We expect that the focus will be on the Real GDP number and that most of the media and the politicians will be bragging that the economy is healthy and back to “normal” But if you look at the CPI numbers for Q3 you can see that inflation is mostly responsible for the growth, meaning it’s not real organic economic activity.
Investments made by Industry (aka capital expenditures), we think will grow and should grow over the next year. The supply chain issues have given business owners pause to review just how dependent they have become on China for goods to be produced cheaper but out of their control, not to mention the additional cost incurred during the issues generated during the pandemic. We expect to see some dollars being spent here especially with people not interested in working, automation is going to become a bigger element in manufacturing.
The Government reduced its spending during Q3 and the last component Net Exports have increased significantly for a few reasons. The strength of the U.S. Dollar has decreased the cost of imports and increased the cost of exports so the spread we expect will lead to a greater export number, for the first time in several years. Imports have also declined in volume so not only has the dollar impacted NE so has the import volume.
The Geopolitical environment is giving investors concern. Not just between Russia/Ukraine but with China reelecting Xi Jinping the UK having its 3rd Prime Minister in the last 2 months and inflation causing struggles throughout Europe, Energy cost during the 4th quarter will be difficult on many European consumers. A recent survey shows that 71% of consumers across six key markets in Europe have already made significant changes to how they shop as they battle to cope with inflation that is reaching levels not seen in four decades. Younger workers may be struggling with lifestyle adjustments which may be apparent in the U.S. in 2023, we’re not sure just yet.
Central Bankers around the world may be getting Fed up with the insensitivity of the U.S. Federal Reserve, which has been causing worldwide financial chaos in the currencies exchange. This includes issues with the U.K’s pensions, its currency, and the currency of Japan. We know that this is a temporary issue and that the exchange rates have fluctuated over history, but the media will drive this point and cause more unnecessary angst. It is possible when things settle down, there will be a basis for switching the U.S. dollar for a different reserve currency, one where no single central bank can be the dominant influence. This is an idea that comes and goes periodically, but, this time, there appears have some legs (a rogue Fed). Such an event would be a blow to the U.S. economy which benefits greatly from the dollar’s reserve status. China has been working on this objective more years and long term their plan is to move things to the Yuan, since they are now the largest seller of goods in the world. We do not think this is an immediate problem but something to pay attention to.
So, let’s look at some of the incoming economic data and determine the real health of the economy, prior to the release of GDP numbers and bias media. We’ll start with housing
Housing:
Housing Starts fell-8.1% M/M in September with Single-Family starts down -4.7% (down six of the last seven months) and down at a -41% annual rate over that seven-month span. Multi-Family starts were also down (-13.2% M/M in September), but they are still up +17.6% Y/Y. The number of apartments under construction is up +27% Y/Y (the highest rate of increase since 1973). When these units come on-line (the private sector data already sees impacts here) the rent inflation that is a large component in the calculation in the CPI and PCE price indexes we think will decline.
Both the Fed and the media have ignored the rapid deterioration that is occurring in the housing market which is the most interest sensitive sector of the economy. New and Existing Home Sales and Single-Family starts are in freefall. Existing Home Sales have now fallen for eight months in a row and Y/Y sales are down -23.8%. The last time that happened was March to October 2007. Those old enough may remember the outcome.
Mortgage purchase applications are down -38% Y/Y. As interest rates have risen, home affordability has fallen due to the increase in monthly payments for a given level of borrowing. Home prices have always adjust downward when rates rise. And, in this case, rates have more than doubled YTD. This is going to impact consumer confidence, at least for the 65% of the population that owns a home and is not a good omen for future household wealth and spending. Of course, we will admit that the low artificial rates over the last decade have conditioned homeowners to think that is normal and that their appetite for more home can be justified. Maybe this will adjust the mindset of home buyers and keep expectations somewhat more reasonable and realistic. The other issue with housing are the institutional home owners that started buying foreclosed homes in 2008 and continued to buy over the last 14 years since bond yields were so low. The home rental market may be the only option for first time homeowners
We do not think that the full impact of housing on the economy has shown up yet in the aggregate economic data, but it will be noticeable in Q4.
The Labor Market:
The is a discrepancy of more than a million jobs between the seasonally adjusted (SA) and not-seasonally adjusted (NSA) data. On Tuesday (October 18) an Investor’s Business Daily headline read: The Federal Reserve Pivot Is Coming In December: Here’s Proof (by Jed Graham). In Grahams opinion, “this year’s seasonal adjustment [provided] an average boost of 539,000 jobs relative to the average seasonal adjustment from March through September over the prior nine years.” The article stated that the October seasonal factors for 2018, 2019, and 2021 reduced payrolls by -465K, -533K, and -709K respectively. Remember, the BLS makes changes to all the SA data all the way back to January each month, but only releases the prior month’s data to the public. The huge discrepancy between the SA and NSA data must disappear by year’s end to balance out the numbers. If the Graham article is accurate, the October Labor Market report may have a major impact on Fed policy making. Unfortunately, that report is due out on Friday, November 4, two days after the Fed’s November meeting. We expect that the Fed is privy to the labor numbers prior to their public release, but, as a result of its hawkish rhetoric for the past months, it is a near certainty that we will see a 75 bps rate rise on November 2. If the October/November labor reports are weak enough, the Fed’s December 13-14 meeting set may not produce a lowered 50 bps expectation. In other words, November may be the last rate hike.
Other incoming labor market data shows that the labor market is likely not as “strong” as the Fed believes, Outplacement firm Challenger reported (October 6) that companies planned to hire 380K workers in September, down from 940K a year earlier and the weakest level since 2011. In addition, layoff announcements in September were up 68% Y/Y while hiring plans were down nearly -60%.
What does this tell you?
Walmart, for example, plans to hire 40K workers for the holidays, this is 110K lower than the 150K last year; Macy’s numbers are 41K this year vs 76K last year. FedEx announced a large cost cutting plan and is closing some sorting facilities. Last year the company hired 100K seasonal employees and hasn’t indicated its intentions for this holiday season.
Microsoft, Meta (Facebook), Twitter, and Netflix have all announced job cuts. And full-time employees are being replaced with part-time (Note that part-time employment has risen 10% Y/Y).
Note that while the current unemployment rate is at a low 3.5% (we will see if it stays there after the October labor report), workweek hours have fallen YTD, and there has been a boom in part-time jobs. (Because BLS counts part-time jobs the same as full-time, we don’t see the emerging weakness in the payroll data.) The tight job market narrative appears to be at play, so businesses are cutting back hours instead of letting employees go.
Finally, let us remember that because the BLS doesn’t survey small businesses, they add a large number (from a time study) each month to the payroll data (called the Birth/Death model). So far in 2022, this number is +950K. The real trend in business formation is negative.
From May to September, multiple job holders have risen by almost +450K while full-time positions have fallen -139K and part-time positions are up +464K. These are not indicators of labor market strength.
Inflation
We are a little tired of speaking about it, but one can’t avoid the elephant in the room. A tighter Fed policy has little immediate influence on things consumers really care about food prices, rents, education, or medical costs. These all were up +0.8% in the latest CPI report. But what a tighter policy does have immediate influence over (interest rate sensitive items) showed disinflation last month:
In September furniture, appliances, and moving expense prices fell -0.1%, -0.3%, and -2.3% respectively (no doubt because fewer homes were sold). Used car prices were down -1.1% (down three months in a row, yes, the supply chain issues seem to be resolved). Prescriptions fell -0.1%, IT services -0.1%, apparel -0.3%, theater tickets -0.6%, sports events -2.9 and hotels/motels -1.2%
In real (inflation adjusted) terms, retail sales contracted at a -3% annual rate in Q3, are down in four of the last five months, and are flat on a Y/Y basis.
Most reporting banks so far in Q3 have raised their loan loss reserves as consumers have borrowed on their credit cards at a record rate.
The NY Fed Empire Manufacturing Index fell to -9.1 in October from September’s -1.5. This was the third straight month the index has been negative. A similar story for the Philly Fed Manufacturing Index (-8.7 October vs -9.9 September). This index has been in negative terrain for four of the last five months and shows that tight Fed policy has begun to impact the manufacturing sector. On the positive side, both the NY and Philly surveys showed continued easing in both backlogs and vendor delivery delays.
A Technical Perspective
For those new readers to our newsletter technical analysis is an investment strategy /trading discipline that relies on identifying opportunities by analyzing statistical trends gathered from trading activity, such as price movement and volume. While no one can identify the bottom and peak price of a security, technical analysis tries to identify opportunities close to it.
When it comes to watching the markets and the trends investors want to see the NASDAQ lead the S&P and the S&P lead the DOW. Right now, we are seeing the opposite. The DOW is outperforming the other two. Why do we want to see things in this order
We want to see the Nasdaq leading the other two indices because the Nasdaq is technology based, and tech is a large component of this market. If the Nasdaq is leading, technology is leading. Why is this good? Because if technology is leading it is a sign that investors have an appetite for risk. Since the Nasdaq is lagging, then it is a sign that investors are concerned about risk and are avoiding it. This is what we are seeing now. The Dow has the least amount of tech exposure of the 3 indexes. Since the S&P 500 is also skewed towards tech, for the market to go up, tech would have to drive much of this movement. However, this does not mean that a big move like last week means that all is good, and that risk appetite is back on. Don’t get misled by the media, especially the morning financial shows. They are focused on sizzle taking information and blowing it up
Bear markets slide a very slippery slope of hope. Friday’s +2.37% outlier may have made investors feel a little bit better, or maybe it could even spark a short rally that lasts a few weeks. The large up move that has continued into Monday might have inspired some optimism, but it was not a good day. All it did was confirm that we are still in a bear market. We are in a bear market for a few different reasons:
Friday was an outlier day, remember an outlier day is when the market moves either up or down by more than 1.50%. Statistically, this should only happen about 13 times per year. In 2021 we had 18 outliers (close enough). However, as of Friday we marked the 67th outlier day so far in 2022.
Outlier days are almost always bad, whether they go up or down. Of the 67 outlier days this year, 33 have been to the upside and 34 have been down. So, even though it has been neck-and-neck between the number of up and down outliers, the result has been the market index declining by -22%. In addition, this turmoil leads to emotional reactions by both professional and nonprofessional investors, which usually magnify the next outlier
Bear markets not only experience more outlier days then tend to show more extreme outliers, for instance a move of +2.37% is a large up-day move. In fact, the largest up day experienced in all of 2021 was only +2.38%. This year however, Friday’s move is only the 14th largest up-day experienced. Bear markets can often do head fakes
Again a positive sign for the markets would be for the Nasdaq index to lead the S&P 500 and for the S&P 500 to lead the Dow (Nasdaq > S&P 500 > Dow Jones). Not the way it is now. The Nasdaq has led the markets for the last several years. Right now, that does not appear to be the case, and the Dow has led both the S&P 500 and the Nasdaq in relative strength.
Aside from the stated facts above, bonds continue to show their aggressive side. Bonds have generally been correlated to the market during the market’s decline. In fact, 20-year treasuries (ETF: TLT) are down more than -35% year-to-date. Remember as prices drop, yields go up so keep in mind the yield and coupon at the beginning of the year was low for those specific bonds to keep yield with newer issues the price needed to decline. In short, this has been one of the worst years to be a “conservative” investor. Source Brandon Bischoff
The Week Ahead
The week of Oct 24th kicks off with PMIs from the U.S., UK, and Eurozone as investors look for insights into recession risks. Several GDP reports arrive as well, adding to the slate of growth specific data, with the U.S. expected to return to positive territory after two straight negative quarters. Monetary policy statements will be coming in throughout the week, with reports from the Bank Of Canada (BOC), Bank Of Japan (BOJ), and the European Central Bank (ECB). The ECB, like the Fed, is standing firm on its rate hiking policy to try and curb inflation and is expected to hike 50bps but may stretch it to 75bps. Earnings season continues with some of the largest names in the market like AAPL, AMZM, MSFT, GOOG, META, and XOM reporting, these companies have the most influence on index movement since they tend to be the most weighted. Also, this week, U.S. durable goods orders are released as well as the Core PCE Price index, giving further insight into the state of inflation. Some housing data will also arrive with U.S. pending home sales and new home sales.
This article is provided by Gene Witt of FourStar Wealth Advisors, LLC (“FourStar” or the “Firm”) for general informational purposes only. This information is not considered to be an offer to buy or sell any securities or investments. Investing involves the risk of loss and investors should be prepared to bear potential losses. Investments should only be made after thorough review with your investment advisor, considering all factors including personal goals, needs and risk tolerance. FourStar is a SEC registered investment adviser that maintains a principal place of business in the State of Illinois. The Firm may only transact business in those states in which it is notice filed or qualifies for a corresponding exemption from such requirements. For information about FourStar’s registration status and business operations, please consult the Firm’s Form ADV disclosure documents, the most recent versions of which are available on the SEC’s Investment Adviser Public Disclosure website at www.adviserinfo.sec.gov/
The Optimized Investor
