
& Other Economic News for the Week Ending

The content of this Newsletter is to provide you with Economic insights to assist you in making better decisions with your investments. Unlike many other financial periodicals we will not mention specific companies, unless it is relevant to an overall economic issue. We welcome your questions on economic concerns and will address in our newsletter. just email us at info@optfinancialstrategies.com #FinancialAdvisor,#investmentmanagement #wealthmanagement #financialplanning #retirementplanning #401kplans
The last two weeks of July pushed all the major indices into positive territory for the month of July with the NASDAQ posting a monthly gain of 12.35% followed by the Russell and the S&P with just over +9% and the DOW coming in at 6.73%. The gains brought all but one index into correction territory. Much of the movement came off of strong tech earnings even with concerns of inflation and a negative GDP report for the 2nd Qtr. Crude oil added 3.5% as the prospect of increased supply remained questionable and U.S. oil firms reported record profits.
While the markets generally use the two negative qtrs. Of GDP as a definition many economists seem to be viewing the data differently. The Fed raised interest rates by .75bps as it made clear that fighting inflation was a top priority. A key gauge revealed that price pressures persisted, as headline inflation rose 1% in June and the core PCE index by 0.6%, both above consensus forecasts.
Consumer confidence fell for a third straight month in July, and companies like Walmart and Procter & Gamble warned of significant challenges for the retail environment in the months ahead.
The U.S. housing market continued its steep correction, as new and pending home sales plummeted in June to the lowest levels since April 2020. Overseas, Eurozone Q2 GDP surprised with 0.7% growth, despite inflation reaching another all-time high at 8.9% YoY as the energy supply crisis deepened. However, the region’s largest economy stagnated, with German GDP unchanged and business sentiment at two-year lows.
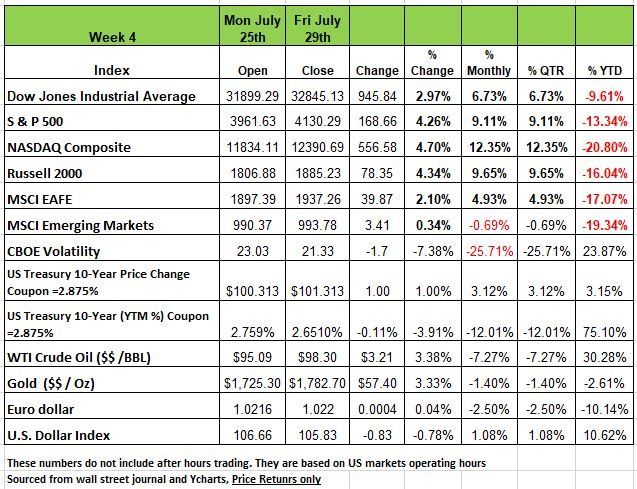
U.S. Treasury bond yields finished the week down across a majority of the yield curve. The 10-year coupon at 2.875% ended the week with a yield of 2.65%. This signals that investors are nervous and moving money to Treasuries for safety, raising prices which lowers the yield. Investors digested a slew of economic data and conflicting commentary, the spread between the two-year and ten-year Treasury yields remained negative, a historic recession indicator.
The big news last week came on Wednesday, the Federal Reserve announced a 75 basis points increase to the fed-funds rate to a range between 2.25% and 2.50%. During the post meeting press conference, Federal Reserve Chairman Jerome Powell told reporters he doesn’t think the United States is in a recession this was followed by GDP data release on Thursday for Q2 at a -.9% drop. What also came as a surprise was Chair Powell stating that he thinks they Fed rate is now at Neutral this did not sit well with many pundits especially Larry Summer former Treasury Secretary.
The week wrapped up with the Fed’s preferred inflation metric, the personal consumption index or PCE, rising 6.8% year-over-year. The 6.8% increase in June was higher than May, and the highest rate since 1982. The PCE data indicates the Fed will need to continue their aggressive rate hikes in order squash inflation. We believe August will be filled with more negative data and that the Fed may not raise rates in Sept and if they do it will be no more than .25% Bps.
State of the Economy
It seems so unfortunate that we can not get a straight answer from those we are supposed to trust the most. The Federal Reserve has always been an institution that was to remain independent and uninfluenced by politics, so that it could make decision in the best interest of the country’s economy. But in 2009 when Ben Bernanke became Fed Chair his philosophy was to make the Fed more transparent. Too much transparency also leads to way too many conflicting opinions from the various Fed governors.
So last week, Wednesday the Fed raised the Federal Funds interest rate (the rate banks pay for reserves) by 75 basis points (bps) ¾ of 1 percent. Bringing the rate from 1.50% to 2.25%, then on Thursday, the BEA reported real Q2 GDP fell -0.9%. That’s the second quarter in a row of negative real GDP growth. Q1 showed up as -1.6%. At the press conference on Wednesday, Fed Chair Powell said that the Fed does not currently view the economy as being in a recession, but he refused to say what action the Fed would likely take at its September meeting, now apparently changing his practice of pre-committing the Fed.
Just a side note there has never been a time in U.S. history when the U.S. had 2 qtrs of negative GDP and not been in a recession. Powell said policy actions would depend on incoming data. Because markets know that the incoming data has been poor, they have concluded that this may have been the last rate increase, or that if there is another rate increase, it will be much smaller maybe 25 bps at most.
Powell also stated that the Fed Funds Rate has now reached the point the Fed considers to be neutral. So, what does that mean? The neutral rate is the theoretical federal funds rate at which the stance of Federal Reserve monetary policy is neither accommodative nor restrictive. It is the short-term real interest rate consistent with the economy maintaining full employment with associated price stability.
Unfortunately, you won’t find the neutral rate quoted on your computer screen or in the financial section of the newspaper. The neutral rate is an “inferred” rate—that is, it is estimated based on various analyses and observations. This rate is not static. It is a dynamic rate that varies based on a range of economic and financial market factors. So, if that does not confuse you think of it this way going above neutral will harm the economy. What Powell is stating is that we are close to the max rate the economy can withstand
So with that the markets reacted as they usually do when the Fed signals a more easing policy. As seen in the chart at the top of the article above all indices had significant positive movement last week. While Powell kept focused on the payroll numbers from June+372K, he downplayed the household survey of -315K in June which has historically been a more accurate predictor of the economy.
We acknowledge that the official arbiter of the U.S. economy is the NBER (National Bureau of Economic Research). They need to look at past data and have often declared the state of the economy well after it has already pasted. Take 2020 for instance, The NBER did not declare a recession until July 19th 2021. This happens because the organization needs to evaluate the Trough and the peak and this can only be done by looking at the past data. The U.S was already out of the recession by the time the information was released in fact 2020 was declared the shortest recession on record by lasting 6 months /2 QTRS.
But if you’re a business owner you do not rely of past data to tell you what is happening. Therefore, the markets look at economic indicators. There are basically two types, leading and lagging indicators. A lagging indicator would be more like the length of time on unemployment and CPI
Powell and the other nay-sayers point to the Payroll Report numbers and to the U3 unemployment rate (3.6%) to back up their “no recession” call. In Q1, Labor Productivity (output/man hour) declined at a -7% annual rate, the largest decline since 1947. Initial data for Q2 imply another decline of about -3.5%. Given the unwanted inventories that Walmart, Target and other retailers revealed in their Q2 earnings reports, it also appears that they over-hired and hoarded labor. Because employee turnover is an expensive proposition for businesses, they tend to first reduce hours worked and overtime. And that is clearly occurring in the manufacturing sector. Layoffs are the next logical step.
As sales have slowed and wages have risen, profit margins for most businesses have fallen. Walmart, Target and most of the retailers have already reported this. That means businesses must “right size.” And that means the unemployment rate will be rising. On a weekly basis, the Department of Labor puts out state by state data showing first time unemployment claims (Initial Claims (ICs)). The latest data for the week of July 23rd shows those ICs have risen to +256K from their lows of +166K in early April. Looking at these numbers from an historical perspective, on average, when such claims rise +76K from their nearby lows, a recession occurs. So far, the latest numbers are +90K above the trough – just another indicator that we are in a recession.
Still not convinced here is some additional information
Several of the regional Federal Reserve Banks put out manufacturing and service sector indexes.
The Philly Fed Manufacturing Index fell to -12.7 in June (0 is the demarcation between expansion and contraction) from -3.3 in May. To show how far from reality Wall Street is, they predicted +0.8!
The Philly Fed also has a business expectations index. This is important because if businesses are downbeat, they will hire fewer employees, will hold off on expansion plans, will cut back on inventory etc. etc. The index from the Philly Fed was -18.6, the lowest in the history of the index going back to 1979! In that history, every time this index fell below -10, a recession occurred.
The NY Fed has a similar expectations index, its six-month Outlook Index. It was -6.2 in July. Only 3 other times in its history has this index been negative: September ’01, and January and February ’09. Do you remember what happened then?
Consumers are feeling the effects of high prices and they have cut back on much of their discretionary spending so we expect a continued decline in retail sales. Lastly the housing industry has been on a decline not just existing home sales being down buy permits for new homes have dropped significantly
As we have penned in the past Treasury Secretary Yellen has a poor track record of looking at the direction of the economy, and believe that politics have taken over the leadership of both the Fed and Treasury and will have disastrous results. Source Economist Bob Barone Ph’D
A Technical Perspective
For those new readers to our newsletter technical analysis is an investment philosophy /trading discipline that relies identifying opportunities by analyzing statistical trends gathered from trading activity, such as price movement and volume. While no one can identify the bottom and peak price of a security, technical analysis tries to identify opportunities close to it.
After putting in a low in June, markets rallied in the month of the July. The rally was largely led by technology-related stocks. The Nasdaq 100 is a mostly tech-related index and studies show that when the Nasdaq leads the markets, it is usually a positive signal, particularly during a bull market. But we all know that 2022 has not been a bull market, but seeing the Nasdaq lead is good development, considering that technology stocks had by-and-large led the markets downward in the first six months of this year.
So here is the big question that investors are asking: “have we seen the market’s bottom yet?” Investors who “panic sold” in June when the market declined now are left with the choice of getting back in at a higher price or waiting for markets to decline further and shift their emotions back from one extreme to the other.
Here is what we do know:
Volatility remains high. Currently, the Volatility Index measures VI 125. That has come off a bit with the recent rally. The S&P 500 hit a high point of VI 148 back in June.
This is not the first time the market has rallied this year, during a bear market. Back in March, after declining -13% from its peak, the S&P 500 rallied +11% in 15 days. Following that rally, the market dropped -20% to the low in June.
We currently see the market as overbought. Looking at some technical indicators, the S&P 500’s relative strength oscillator index (RSI) is above 70, which means that its price movement is overextended, and AIQ Trading Expert Pro’s expert rating shows that the index is 91% overbought. Does this mean that market won’t continue to go up? No, but it shows there is a higher probability of a decline than there is a further rally.
In the chart below, we have highlighted two of these points
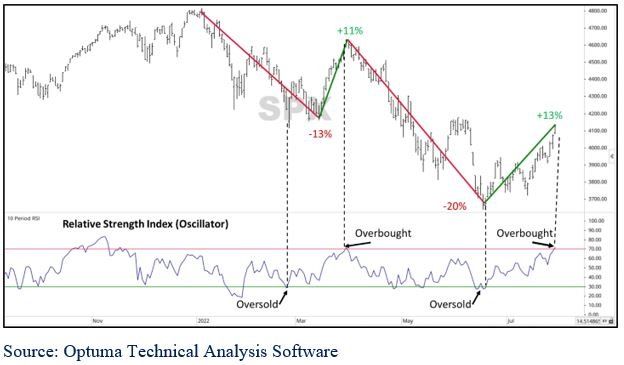
First, we illustrate the swings in the market. You can see that a -13% decline was followed by an increase of +11%, before declining another -20%. Now, the market has seen a +13% rally. Will that rally continue, or will we see another decline? So far the week is off to a poor start
Second, the chart shows the Relative Strength Index (Oscillator) which measures the strength in the price movements of an individual index or security. The indicator uses lines at RSI 30 and RSI 70 to measure if a security is overbought or oversold. You can see when the index has become oversold, it rallied. On the other hand, after the +11% rally in March/April, the index became overbought and declined. Now, once again, the index is overbought. It should be noted that being overbought does not guarantee a substantial decline. Securities can remain overbought for a period of time. Remember that we need to buy low and sell high, unfortunately most people do the opposite as emotions tend to drive much of the decision-making process. Source Brandon Bischoff
The Week Ahead
The FOMC removed forward guidance from last week’s statement, saying that its next steps will depend on data released between now and the next meeting in mid-September. Inflation numbers will remain top of mind, but with two consecutive quarters of contracting economic growth, the U.S. labor market will be closely scrutinized for confirmation of recessionary conditions. Jobless claims have been on the rise and high-profile companies are freezing hiring, so this week’s employment data is timely.
The JOLTS job openings report drops Tuesday, followed by unemployment claims Thursday and the monthly non-farm payrolls on Friday. This week also features ISM PMIs, which are expected to decline but remain in expansion territory. Factory orders, trade balance figures, and consumer credit round out the domestic calendar. Internationally, central banks are in focus, with the Bank of England potentially poised for the first 50bps rate hike in its 25 years of independence. The RBA is expected to implement its third straight half-point increase as inflation becomes more entrenched in the Australian economy. Lastly, China releases PMIs as embattled property developer Evergrande faces a debt restructuring deadline.
This article is provided by Gene Witt of FourStar Wealth Advisors, LLC (“FourStar” or the “Firm”) for general informational purposes only. This information is not considered to be an offer to buy or sell any securities or investments. Investing involves the risk of loss and investors should be prepared to bear potential losses. Investments should only be made after thorough review with your investment advisor, considering all factors including personal goals, needs and risk tolerance. FourStar is a SEC registered investment adviser that maintains a principal place of business in the State of Illinois. The Firm may only transact business in those states in which it is notice filed or qualifies for a corresponding exemption from such requirements. For information about FourStar’s registration status and business operations, please consult the Firm’s Form ADV disclosure documents, the most recent versions of which are available on the SEC’s Investment Adviser Public Disclosure website at www.adviserinfo.sec.gov/
The Optimized Investor
