
Market and Economic Climate
from the Week Ending July 22, 2022

The content of this Newsletter is to provide you with Economic insights to assist you in making better decisions with your investments. Unlike many other financial periodicals we will not mention specific companies, unless it is relevant to an overall economic issue. We welcome your questions on economic concerns and will address in our newsletter. just email us at info@optfinancialstrategies.com #FinancialAdvisor,#investmentmanagement #wealthmanagement #financialplanning #retirementplanning #401kplans
U.S. equities showed signs of life last week with all 4 of the major indices ending the week in positive territory. The Russell 2000 led the pack with a +3.58% increase followed by the NASDAQ +3.3% , S&P +2.55% and the DOW +1.95%. All of this came in spite of fear of an economic slowdown and Friday’s selloff. The week brought the S&P and the Russell back into correction territory from Bear market. But the year is still at its mid-point and we have a long way to go.
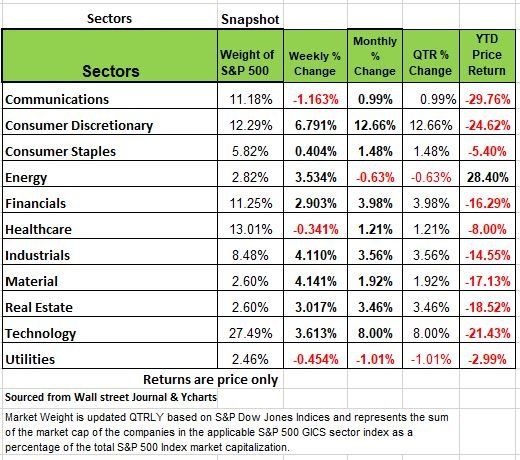
9 of 11 S&P500 sectors ended positive, led by a 6%+ jump in consumer discretionary and 4% gains in materials, energy, and industrials. Crude oil finished a volatile week in the red by 3% as YoY U.S. gasoline demand plunged.
U.S., economic data is beginning to show signs that recession risk is rising. The services sector contracted for the first time in 2+ years and manufacturing activity stalled. Regionally, the Philly Fed index dropped to -12.3 in July. U.S. housing data continued to deteriorate, with existing home sales falling 5.4% MoM and 14.2% YoY in June, while housing starts fell to a 9-month low and homebuilder confidence sank to pandemic-era lows.
In Europe, the ECB surprised with a 50bps rate hike, its first in 11 years, and agreed to a new bond purchase plan for the EU’s more indebted nations, but details were vague.
German PMIs unexpectedly shrank in July as inflation and supply chain woes weighed. In the UK, inflation hit another new high and BOE Governor Bailey hinted at a larger rate increase for the upcoming August meeting.
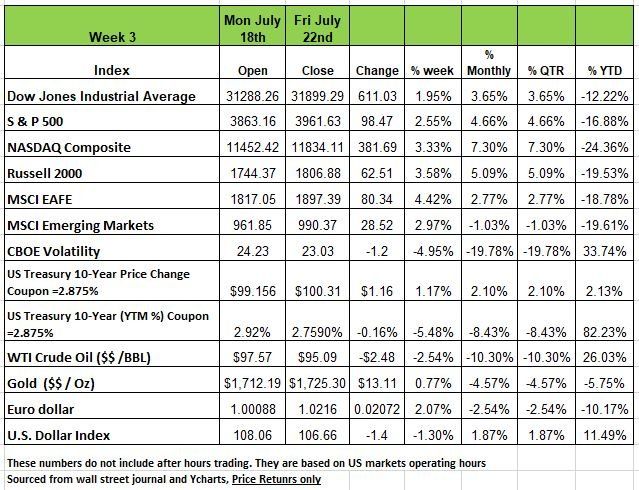
Treasury yields tumbled after U.S. jobless claims rose for a third straight week and global flash PMIs showed softening business conditions. The shift to Treasuries is a sign of fear on weaker economic conditions increased investor concerns that a recession is more probable and that the Fed will ease pressure on raising rates. This resulted in a flatter yield curve
Oil dropped to $95.06 a -24% drop from its June peak price. While the current job market is very tight, contrary to typical recessionary conditions, there was a cooling observed in last week’s US jobless claims reading - and jobs data will be closely watched for any signs of weakness. Housing data from June which was digested by the markets on July 19 and 20 saw marked declines in both housing starts and existing home sales.
Comparing Data
Things change! This is a fact of life. As societies evolve so does everything associated with it. The financial industry is no different. In comparing the industry today to how it was in the 1970’s is like comparing night and day. When the media tries to scar Americans old enough to remember the challenges on the late 70’ and 80’s and inflation, they are comparing different situations. Inflation today is calculated much differently than it was in the 1980’s. Back then the housing component used in the calculation was based on home prices, not rent. But back in the 1990’s this changed to using rent. why? Because housing prices kept going up and rents were more stabilized at least until this past year. Some economist argue that a house is an investment while rent is a require expense for shelter. But this is not the only items that was changed. We now measure different items and substitute, such as the types of food measured. But the biggest change is the weight of the items measured this is updated every 2 years which makes comparing a number today to a number 20-30 years ago
But there was another motivation behind this move, social security benefits increases are based on inflation. The lower the inflation number the less the government has to payout in social security benefits. I am sure that you have heard enough about the Social Security trust going broke by the 2030’s.
But for those retired individuals whose bulk income is dependent on social security, this does not translate well especially since older Americans tend to need more in medical care and are often hit with high prescription cost which exceed the rate of inflation. In addition, the money taken out of a worker’s paychecks has such a small return over the period of their work life that one would do much better having it managed by anyone other than the government. Our point the bigger government is and gets involved in our lives, the more it screws things up for the working class. Source https://www.nytimes.com/2022/05/24/technology/inflation-measure-cpi-accuracy.html
The Passive Strategy Flaw
Over the past 20- years many investors have moved their investments strategy from actively managed portfolios to passive. You may have heard an advisor state that you can’t outperform the market by actively managing your portfolio, so the best strategy is to buy index and ETF’s. In fact, efficient market hypothesis is based on this theory. The industry uses this strategy not because its in the investors best interest, but because it’s the easiest way for an advisor to manage a portfolio. In a Bull market this very strategy will keep most investors happy.
But how well does this strategy work in Bear markets? Let take a look at what is required in terms of break even when your portfolio drops.
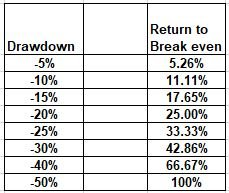
In looking at the chart above you will notice that small declines do not require that much of an increase in order to get back to breakeven. However, as the declines get larger the required return to get back to breakeven increases significantly, especially once you pass the -20% mark. What also happens with this strategy is that the investor also loses out on at least one year of gains. One year may not sounds like a big deal but it translates into something deeper. Not only do you need a larger return to break even, you will also need a larger return for multiple years to play catchup. If you are working off an average return per year then, the next year you not only have to make up the difference but you also need to make the required return for that year.
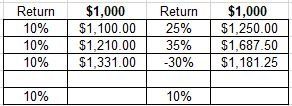
Here is another way to look at the numbers, in the scenario below both portfolios have an average return of 10%. You will notice the portfolio on the left while constant at a 10% return each year, yields 14% more over 3 years than the portfolio on the left with two years of high returns and one year of a -30% loss.
The point here is that many advisors use a benchmark to compared portfolio performance. It appeals to our greed. Why not max out the most for my investment risk and for many it seems like it makes sense. But the focus should not be on the portfolio but on you and your financial plan. Is your portfolio on track to meet your needs and objectives. Is your portfolio generating income for you or is it on auto pilot and just reinvesting dividends at higher prices, because the market was showing some momentum and your strategy was to ride the wave?
If your portfolio is down 14% from where it needs to be as you approach retirement then you have some challenges. Especially If you purchased securities throughout the time period when prices were rising and now with prices lower you need to liquidate to generate income. The worse position and investor can be in is to need money and have to sell at a loss.
Economic Cycles & the Market
There are four basic cycles to an economy Trough (low point) Expansion (growth) Peak (high point) and Contraction (shrinkage) If you are wondering how the markets react to this you can correlate the markets movement to the economic cycle we are in, or approaching. A Bull market occurs when the economy is in its Expansion period and continues until it hits the Peak. A Bear market occurs when an economy is entering the contraction cycle and continues until it hits is Trough. The hard park it to figure out when an economy is in the Peak and Trough cycle. The NBER usually announces this after the fact and that does not help investors. But you do not have to be a genius to understand the other two cycles. If you pay attention to some of the leading economic indicators you can see the direction the economy is heading and the markets will usually move in that direction. Now to be clear this is not a smooth ride. These transition periods have a lot of market volatility and an investor needs to have the stomach to handle the movement. But understanding the basics of a company’s financial health and products they provide can help you get an edge and manage your gains and losses better. With that lets take a look at some of the data
Housing Data
One of the largest contributors to an economy is home building, because so many other industries are impacted by it. Appliances, Landscaping furniture just to name a few. Of late, cracks are beginning to appear in housing, a sector many believed (and still do) is somehow immune from recession. But all we have to do is go back to 2008 and see what happened then.
The following are two well-known leading indicators for the new home market, let’s take a look and see what the data is saying:
- Homebuilder Sentiment (National Association of Home Builders’ (NAHB)) – these are the voices of the homebuilders, themselves. The overall index fell to 55 in July from 67 in June, still positive (50 is the demarcation between expansion and contraction) but down significantly. This index stood at 79 in March, and, except for April 2020 (the pandemic), July represents the largest one month drop in the survey’s history. Over the past month, 13% of home builders reduced prices.
- The Prospective Sales Sub-Index fell to 50 from 61, and, Potential Buyer Traffic plunged significantly into negative territory at a reading of 37 from an already negative June reading of 48.
In the hot markets such as Boise, Salt Lake and Denver, 50% of existing homes for sale have dropped prices. Housing starts have fallen now for four months in a row, and down -2% in June after falling -12% in May. The all-important single-family sector fell -8.1% in June and building permits for single-family starts were also down. These declines are unusually large. This according to Redfin. So, if you think this sector is immune to a recession think again
On the bright side multi-family units rose +10.3%, this along with the current large number of multi-family units already under construction, should come on-line during the 2nd half of the year. So, the good news is that rents, which have been a big component of inflation, should see a drop from the sky-high numbers of the last 12 months.
Existing Home Sales fell -5.4% in June, are down -14.2% Y/Y, were at the slowest pace since May 2020 (again the pandemic) and, before that, January 2019. It is important to understand that these are closings whose original contracts were likely signed in April, before the big spike in mortgage rates.
We can expect worse numbers in the near future, and can foresee such because mortgage applications are now at a 22-year low, down -6.6% W/W for the July 15 week and off -60% Y/Y.
The all-important refi sector was down -4.3% W/W and now down -80% Y/Y. In addition, the mortgage rate spike has caused a significant rise in contract cancellations, now at 15% in June (12.7% in May), the highest rate since April 2020 (i.e., pandemic). Finally, it is quite telling for the housing sector when the large mortgage originators begin to shed staff as both JP Morgan and Wells have just announced.
Sentiment and LEI
The Conference Board’s Leading Economic Indicators fell -0.8% in June after a fall of -0.4% in May, and are now down four months in a row and five of the last six. Since its inception in 1959, when the LEI have fallen in four consecutive months, a recession has ensued one-hundred percent of the time.
We have highlighted the University of Michigan’s Consumer Sentiment Index for the last several months. It has been, and still is, an excellent leading indicator. The drop in confidence as well as business conditions for the next year are at all time lows
Regional Fed Indexes
The Philly Fed Manufacturing Index fell to -12.7 in June. The consensus estimate was +0.8! which shows how far off the narrative of a soft-landing is. In May, this index was also negative (-3.3). The new-orders sub-index was -24.8 (vs. -12.4 in May). June Expected Business Conditions six months hence at -18.6 was the lowest recorded number since 1979. The May number was -6.8. Every time this index has been -10 or lower, a recession has occurred.
It is noteworthy that the NY Fed Empire Manufacturing Index’s Six-Month Outlook was -6.2 in July. In the history of the Empire Index, this component has only been negative three times: September ’01, and January and February ’09. You all know what happened next!
Back to the Philly Index, the employment, workweek, and inventory measurements were all lower. Finally, and on a positive note, unfilled orders, supplier times, and prices paid and received were all lower, indicating that supply bottlenecks have begun to ease, a positive sign for inflation.
The Changing Labor Market
Initial Claims (ICs) for Unemployment have been slowly rising since March with their pace quickening of late, rising to +251K the week ended July 16. They are now +85K higher than their March low. Historically, on average, +76K has been the recession signal.
Those hoping for a soft-landing point to the “strong” labor market where “now hiring signs are omni-present.” However, the indicators, including ICs, are now pointing to a significant change in that labor market narrative.
To begin, the horrible Q1 productivity number (-7.3%) is destined to be repeated in Q2, as businesses over-hired and hoarded labor, believing the overly-tight labor market narrative (i.e., the narrative was self-fulfilling).
Right-sizing is starting to occur, as evidenced by the -350K reading in June’s Household Survey (showing negative numbers now in two of the last three months). That Household Survey, by the way, is used to calculate the Unemployment Rate and is much more sensitive to changing labor conditions than the headline grabbing Payroll Survey.
The reason why the Unemployment Rate did not fall in June despite the fall in the number of jobs was because the labor force (the denominator) also shrank. It is now apparent that changes in the labor market have already, or are about to, occur, as inflation, the recession, and falling equity prices push people back into the labor market.
The Washington Post recently reported that 1.5 million of the 3.0 million workers who took early retirement during the pandemic have re-entered the labor force. The reasons given were inflation (65%), falling equity prices (45%), and rising interest rates (30%). A Quicken Survey found that nearly half who planned to retire in 2022 have put that plan off. It appears to us that a rising labor force will soon push up the official Unemployment Rate.
The number all investors will be focusing on in August will be July’s CPI. We expect it to decline as oil prices have dropped and supply chains have eased and more rental homes will come on the market. The Fed will have to weigh heavily of just how much further it will go to keep raising interest rates. We think they realize a soft landing is no longer feasible. The bottom line is that the pandemic, while challenging was handled poorly. The excess money that was sent to consumers and how the consumer behaved with that money has all contributed to the economic condition we are now experiencing. So it is our opinion that the economy is in the contraction phase of an economic cycle and with that pay attention to your investment strategy. Source Economist Bob Barone Ph’D
The Week Ahead
Investors might want to strap in for numerous high-impact events, the biggest being the FOMC statement on Wednesday. The Fed is expected to raise rates by another 75bps, but the question remains whether recent economic data has swayed the committee to ease off going forward. On Thursday, the first look at Q2 GDP will reveal if the U.S. has fallen into a technical recession. Forecasts call for modest growth of around 0.5% after Q1’s 1.6% contraction. Then on Friday another inflation update arrives with June’s Core PCE Price Index, which has declined for three straight months. It’s also a pivotal week for earnings, with many large U.S. multinationals and technology stocks reporting. So far, most companies have beaten dampened expectations while some have shifted to a cautious tone on new hiring. It will be interesting to see how sky-high inflation and the soaring U.S. dollar have impacted corporate profits for companies like Apple, Microsoft, UPS, Amazon, and Exxon Mobile. Overseas, the focus will be on Eurozone inflation figures which could approach 9% YoY.
This article is provided by Gene Witt of FourStar Wealth Advisors, LLC (“FourStar” or the “Firm”) for general informational purposes only. This information is not considered to be an offer to buy or sell any securities or investments. Investing involves the risk of loss and investors should be prepared to bear potential losses. Investments should only be made after thorough review with your investment advisor, considering all factors including personal goals, needs and risk tolerance. FourStar is a SEC registered investment adviser that maintains a principal place of business in the State of Illinois. The Firm may only transact business in those states in which it is notice filed or qualifies for a corresponding exemption from such requirements. For information about FourStar’s registration status and business operations, please consult the Firm’s Form ADV disclosure documents, the most recent versions of which are available on the SEC’s Investment Adviser Public Disclosure website at www.adviserinfo.sec.gov/
The Optimized Investor
