
Economic and Market News from the Week Ending July 15th 2022

The content of this Newsletter is to provide you with Economic insights to assist you in making better decisions with your investments. Unlike many other financial periodicals we will not mention specific companies, unless it is relevant to an overall economic issue. We welcome your questions on economic concerns and will address in our newsletter. just email us at info@optfinancialstrategies.com #FinancialAdvisor,#investmentmanagement #wealthmanagement #financialplanning #retirementplanning #401kplans
U.S. equities got off to a poor start last week and then inflation fears unexpectedly worsened with Wednesday’s CPI release. Inflation came in at a whopping 9.1% YoY, the strongest annual increase since 1981. But unlike the 80’s we know the cause here. When June’s prices were taken WTI was at $120/barrel on Friday that number was down below $100
At Thursday’s lows, the S&P500, NASDAQ 100, and Russell 200 were all down nearly 5% for the week but Friday’s rebound came off data on better-than-expected retail sales and consumer sentiment figure. This helped reduce the weeks declines.
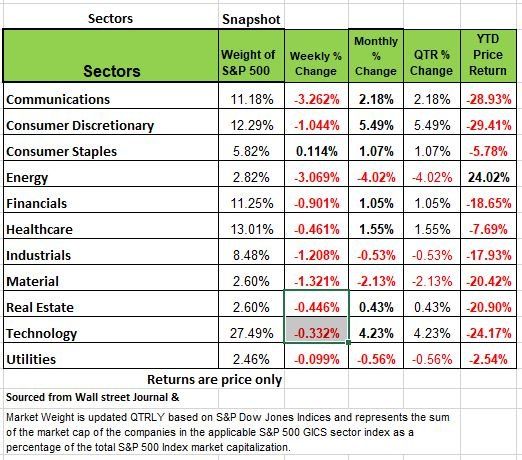
Of the 11 S&P500 sectors only consumer staples show a small gain the rest of the sectors were in the red for the week. Energy was down -3% with Crude oil’s price sliding 7%.
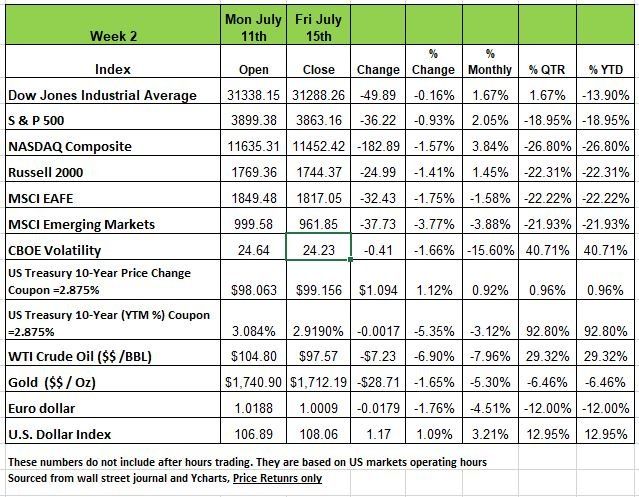
Treasury yields erased their initial weekly gains as the 10-yr Treasury settled in below 3%, keeping the yield curve firmly inverted. This again coming on concerns of inflation and that the Fed may increase rates next week by 1%. The U.S. dollar index continued its rally, reaching a 20-year high as the greenback gained against most other currencies despite conflicting data. The Euro currency’s woes continued, trading at parity with the U.S. dollar for the first time since 2002. This is a concern for Europe and the cost of living for many Europeans and with Energy being a concern this winter Many will be struggling just to have the basics.
The Bank of Canada raised their target interest rate 1%, well above expectations and the largest increase in 25 years. The trend of rising rates has started to affect the housing market as homebuyers are cancelling contracts at the highest rate since the start of the pandemic, many homebuyers no longer qualify at the new mortgage rates. GDP out of the UK beat expectations along with industrial and manufacturing production. Reports out of China were bleak as growth slowed to just 0.4% last quarter largely due to extreme lockdowns from rising COVID cases.
The spread between the 10-year yield and the 2-year yield finished the week at negative 21-basis-points. The producer price index also increased 11.3%, above expectations of 10.7%. This also led investors to speculate that the Federal Reserve may increase interest rates at an even faster pace in order to slow down inflation. After Wednesday’s inflation reading, the market expected at least a 75-basis-point rate increase in the Federal Funds Rate and the market implied probability of a 100-basis-point rate.
Good Intentions? Maybe Not
If a good intention has destructive results, should the entity continue with its policies? As the old proverb states the road to hell is paved with good intentions. Or in this case the road to a recession. There have been many bad decisions made over the last several years and much of what we are feeling now is a result of those decisions.
“Government has three primary functions. It should provide for military defense of the nation. It should enforce contracts between individuals. It should protect citizens from crimes against themselves or their property. When government—in pursuit of good intentions—tries to rearrange the economy, legislate morality, or help special interests, the cost comes in inefficiency, lack of motivation, and loss of freedom. Government should be a referee, not an active player.” This quote is from Milton Friedman famous economist from the University of Chicago.
For the last 14 years Americans have not had to deal with too much inflation. Perhaps 3% was the highest rate in any one year over this period. One reason is that technology has allowed businesses to be more efficient with their operations especially inventory control. But the pandemic threw a wrench into everything. Being more dependent on China for manufacturing products or components of products, the interruption and delays in orders forced many businesses to over order. So, we had an unnatural spike in GDP.
In addition, the trillions of dollars of monetary and fiscal stimulus pumped into the U.S. economy by the federal government to help mitigate the fallout from the pandemic has ignited inflation. The Federal Reserve’s (“Fed”) quantitative easing (bond buying) increased its balance sheet of assets from $5.81 trillion at the start of Q2’20 (COVID-19 onset) to $8.91 trillion at the close of Q2’22, according to Bloomberg. Actions, however, can have unintended consequences. The Fed has a plan to bring down inflation. It includes raising interest rates (underway) and a gradual paring of its balance sheet.
That wasn’t normal. In the 1990s, a 3% annual Consumer Price Index reading was common and almost unremarkable. CPI approached 5% in 2005 and was briefly over 5% in 2008. But from 2012 until last year, 3% was a hard ceiling—to the point where Federal Reserve officials worried more about generating inflation than preventing it.
“Those that cannot remember the past are condemned to repeat it” this is a well know quote from the early 1900’s by George Santayana. The point here is the people we entrust the most to lead us and whose very job is to know the lessons of the past, just seem to ignore them. Maybe this should not be such a surprise as we find so many worried about their own specific agenda. The decision made back in 2008 from the great recession have laid the foundation for todays issues. Consumers and business leaders have been conditioned to access capital basically free and regardless of how poorly they managed it, there was more available.
The Feds own policies created asset inflation in stocks and housing markets. This seemed to be fine until it expanded into broader categories. Well now that inflation is here with a vengeance the Fed is playing catch up and rapidly tightening money supply while rising rates. The result is that the economy is showing signs of weakness and the concern is how deep an economic slump we will be created.
Climate
There are plenty of pundits out there arguing whether or not the U.S. Economy is in a recession. As we have penned in the past the number of financial professionals offering insight into our economy vary greatly.
The official arbiter for the state of our economy is the responsibility of the NBER Business Cycle Dating Committee. The problem is that their metrics are vague about the specific indicators on which they base their decisions.
There is, however, a general belief that there are four big indicators that the committee weighs heavily in their cycle identification process. Below are four of the indicators and our opinion on them:
There is conflicting employment data come from two different surveys—one of employers and one of households—used to calculate employment, unemployment and other key figures in the Labor Department’s monthly jobs report. The divergence raises questions about the labor market’s overall strength as more signs point to a slowing economy.
The survey of employers shows nonfarm payrolls growing by an average of 375,000 jobs a month over the past three months. The household survey shows the economy losing an average of 116,000 jobs a month during the same span. This conflict leads us to believe the negative results more than the positive one.
While this indicator has shown the second-best recovery out of the four. Producers and suppliers struggle with limited inventory and continued supply-chain issues.
Appear to have bounced back most rapidly but the numbers are influenced by higher prices not volume and we do not expect to see this level maintaining. We are starting to see “on Sale signs” indicating higher than needed inventory
Real Personal Income (excluding Transfer Receipts)
has shown the weakest recovery. Income has been an ongoing issue in terms of trends and matching inflation over the years. With higher prices at the gas pump and grocery checkout we think consumer will have less to spend on discretionary items.
The economy is represented by four Business cycles. Trough, (the bottom) Expansion (growing) Peak (the top) and contraction (shrinking). As you might conclude these cycles can only be evaluated after a period of time has lapsed. Recessions are represented as the peak month through the month preceding the trough. For example, the NBER dates the last cycle peak as December 2007, the trough as June 2009 and a duration of 18 months. The "Peak through the Period preceding the Trough" series is the one FRED uses in its monthly charts, https://fred.stlouisfed.org/series/USRECM
Technical Perspective
As we enter mid-July, volatility in the broad markets remains high and the market is in a short-term trading range, with neither the upside nor downside winning out just yet.
Market Breadth
Over the last few weeks, Nasdaq’s relative strength to the S&P 500 has ticked upward. This is normally a bullish indication—one would expect technology stocks would outperform during market rallies. However, over this time period, both the Nasdaq 100 and S&P 500 have put in a very short series of lower highs. Meaning the bounce is not quite as high as before. Additionally, when we look at market breadth, it still remains weak.
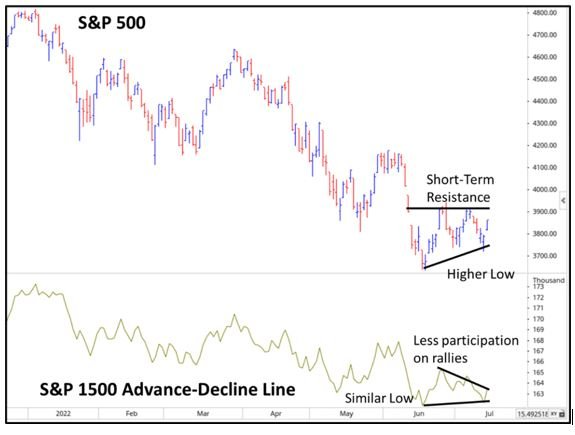
When we have discussed market breadth in the past, using the Advance-Decline Line (A/D Line), it has been during an upward trending bull market. In the case of a bull market, ideally you would like to see a rising tide lifting all ships. Now that the markets have entered a bearish period of high volatility, we are waiting for the A/D Line to show signs of “positive divergence,” meaning that if the market puts in a new relative low point, the A/D Line does not. If the market puts in a new relative high point, then we want to see the A/D Line puts in a higher high.
Right now, the A/D Line appears to be weaker than the S&P 500. While the market has seen a short-term, sideways trading range, with some higher lows, the A/D Line has experienced similar low points, and lower high points. You can see this in the chart below, which shows the S&P 500 with the Advance-Decline Line of the S&P 1500. As the market has had some up-swings, less stocks are participating in the short rallies.
As mentioned above the Nasdaq has had rising relative strength over the past few weeks. The Nasdaq index is largely technology-dominated. So, while tech stocks have outperformed the general markets in the short-term, they have certainly underperformed in the grand scheme of 2022. Right now, the top 3 US sectors are as follows:
Health Care
Utilities
Consumer Staples
These sectors are most often referred to as defensive plays during slow or negative economic conditions.
Information Technology holds the 5th spot; Consumer Discretionary (Amazon & Tesla) are in 6th; and Communications is near the bottom of the sector rankings at slot #9 (out of 11 sectors). Basic Materials and Financials are the worst two sectors right now.
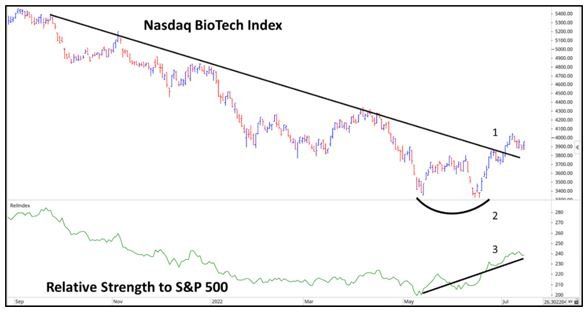
Looking at various market industries, BioTech is the top ranked industry in our universe, on a risk-adjusted basis. After struggling to find any momentum, and repeatedly putting in lower highs and lower lows, it has found a bit of strength recently. The chart below shows the Nasdaq BioTech index. Here are a few points on the chart:
(1) Breakout above the previous trend of lower highs
(2) Double Bottom—the index did not put in a lower low, and instead matched the previous low and trended higher
(3) Rising Relative Strength
The Bottom line here is that the markets are in a short-term trading range. Volume has declined. Right now, more traditionally “defensive” sectors are leading while the tech-oriented sectors fall in the middle or bottom of the sector rankings but have seen a little bit of strength recently. The few up-days we have seen since the market’s low in mid-June have not had significant participation—market breadth is weak.
The market has a lot of negativities it needs to fight through. Whether it is talks of inflation, the Fed, or recession, the market is still volatile and has more working against it right now than it does for it. Even though Friday was a large up-day of close to +2%, that is a bear market characteristic.
From a portfolio management perspective, the short trading range we have seen allows us to identify areas of rotation. We have seen strength shift away from certain market sectors and into areas like BioTech or Consumer Staples.
We expect the market to remain volatile, in both directions, as it figures out where it wants to go. Courtesy Brandon Bischoff
The Week Ahead
The trend in rate hikes looks to continue this week as the ECB is preparing for its first-rate hike since 2011 on Thursday in attempts to curb inflation and support their currency. Consumer inflation data in the Eurozone will emerge Tuesday, and economists expect no let up for inflationary pressures. The U.S. housing market has shown signs of cooling, and we’ll get further information in Tuesday’s housing starts and Wednesday’s existing home sales reports. PMI reports will be coming in on Friday from the U.S., Eurozone, Germany, France, and Canada. Earnings season started last week with banks reporting fairly mixed results, while several closely watched companies report this week.
This article is provided by Gene Witt of FourStar Wealth Advisors, LLC (“FourStar” or the “Firm”) for general informational purposes only. This information is not considered to be an offer to buy or sell any securities or investments. Investing involves the risk of loss and investors should be prepared to bear potential losses. Investments should only be made after thorough review with your investment advisor, considering all factors including personal goals, needs and risk tolerance. FourStar is a SEC registered investment adviser that maintains a principal place of business in the State of Illinois. The Firm may only transact business in those states in which it is notice filed or qualifies for a corresponding exemption from such requirements. For information about FourStar’s registration status and business operations, please consult the Firm’s Form ADV disclosure documents, the most recent versions of which are available on the SEC’s Investment Adviser Public Disclosure website at www.adviserinfo.sec.gov/
The Optimized Investor
