
Is Your Portfolio on Auto Pilot
& Market Year End Review for 2022

The content of this Newsletter is to provide you with Economic insights to assist you in making better decisions with your investments. Unlike many other financial periodicals we will not mention specific companies, unless it is relevant to an overall economic issue. We welcome your questions on economic concerns and will address in our newsletter. just email us at info@optfinancialstrategies.com #FinancialAdvisor,#investmentmanagement #wealthmanagement #financialplanning #retirementplanning #401kplans
What a difference a year can make. 2021 certainly had its share of headwinds from the pandemic, the impact on the U.S. financial markets was subdued compared to 2022. In late 2021 we began to see runaway consumer prices and the Federal Reserve sprang into action last year. Over the course of seven rate hikes, they increased the federal funds target rate (upper bound) from 0.25% (where it stood in March), to 4.50% as of 12/30/22. U.S., housing affordability fell to a decade low as mortgage rates surged along with the federal funds rate. The personal savings rate plummeted as well, registering quarter-over-quarter declines in each of the last five quarters through 9/30/22, this from the U.S. Bureau of Economic Analysis. Jobs seems to be the head scratcher as it appeared to be relatively strong but we are finding out some of those numbers were incorrect and the labor market is expected to weaken throughout 2023 as companies freeze hiring and announce layoffs.
The final week of 2022 ended down but only slightly compared to a year that saw the market benchmark (S&P 500) lose more than 19 % amid rising inflation and interest rates.
While the DOW performed well in the last quarter of the year +15.39% the Index ended the month down -4.17% and -8.78% on the year. This was mild compared to the other 3 indices. The S&P 500 ended at 3,839.50 only a -.04% decline on the 4-day week but -5.90% drop in the final month of the year While the S&P had a +7.08% increase for the last quarter of the year it was not enough to help the drop of -19.44% for 2022. Both the NASDAQ and the Russell 2000 end with larger declines of -33.1% and -21.56% respectively.
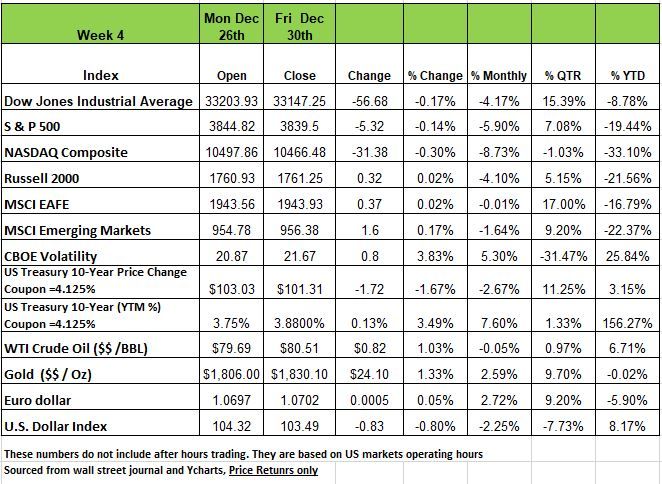
2022 was not only a bad year for Equities it was also a horrible year for Bonds. It is extremely unusual for both Bonds and equities to move in the same direction (price wise) in a given year. Bonds prices dropped significantly as the Fed continued raising rates and the value of Bonds with lower coupons declined rapidly. Those investors that held Bond ETF’s or mutual funds at the beginning of the year lost big and NAV of these funds dropped double digits in the first half of the year. At the beginning of 2022 the 10 yr. Treasury had a coupon of 1.375%, ended the year with a coupon of 4.125% so the value of that Bond you owned in January dropped to $776.5 per bond giving you a loss in value of -$223.48 more than 22% decline the same was seen in the Corporate Bond market.
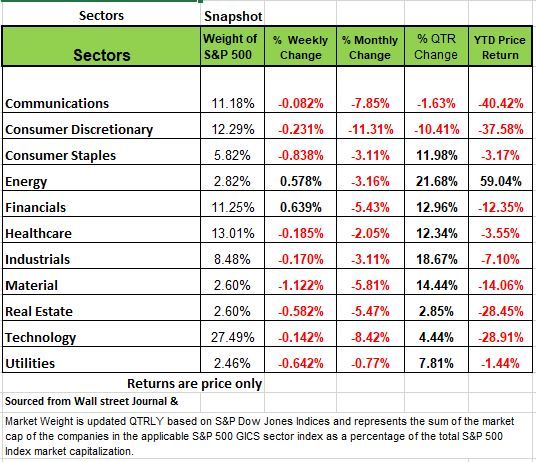
Every sector except energy fell this year. Communication services suffered the largest percentage loss in 2022, tumbling 40%, followed by a 38% slide in consumer discretionary and a 29% drop in technology. Energy jumped 59%.
For the week, every sector except financials and energy declined. Materials had the largest percentage drop, down 1.2%, followed by a 0.8% decline in consumer staples and drops of 0.6% each in utilities and real estate. On the upside, financials rose 0.7% and energy edged up 0.6%.
The US stock market was closed on Monday in observance of New Year's Day. On Tuesday and Wednesday, investors will receive some manufacturing and construction data, but much of the market's attention will likely be on the expected release Wednesday afternoon of minutes from the latest FOMC meeting, while looking ahead to December employment data coming Thursday and Friday. ADP will release its private sector December employment data on Thursday while the US government's December nonfarm payrolls and unemployment rate are expected on Friday.
Is your Portfolio on Autopilot
As you look bad on the year and more importantly your portfolio, take a moment to look closely at how well you did. Do you know what it is comprised of? Is your entire portfolio made up of index, ETF, and mutual funds? Take a moment to ask yourself why you have the investments you have? Did someone, maybe an advisor, tell you that the best way to diversify your portfolio was to own broad-based funds? Maybe you were told that you can’t outperform the market and that owning the S&P index over time would provide you with the best returns. Well maybe there is some merit to that philosophy but let’s take a look closer.
Since January of 2000 through the end of last year December 2021 the S&P had and average annual return of 10.83%. For many this may seem like a reasonable return. At the end of 2022 that average return dropped to 7.45% a significant drop in one year. But these are averages and investing does not work from average returns It uses Geometric returns a compounding calculation and negative years cause a significant challenge.
Below are two portfolios A & B in both cases the 3-year average is 10%. But the result at the end year 3 is significantly different, even though the first two years in Portfolio B had much higher returns.

The net difference after year 3 between the two example is $149.75% or 14.98%. This may not seem like much if you are younger and have plenty of time until you need to use the money you invested.
However, if you are approaching retirement or already in retirement, this can cause you significant financial issues. If your investment plan is based on the average return of the S&P 500 which prior to 2022 was 10% you need to realize that a decline in portfolio value of -20% as we had this year requires a return of 25% the following year just to break even.
If we used the NASDAQ numbers (see index chart) as an example -33% decline for the year will required a return of 49.4% to break even. But this is not where it ends. If your financial plan or needs for retirement are based on an assumption of 10% annual return, not only do you need to make back more than what you lost in the decline, but you also fall behind another year in gains, so in the example above you would need make an additional 14.9% to get back on track. Anything less than this puts your retirement in jeopardy. Especially if you are already in retirement and made long term commitments based on those assumptions.
Another real-life example is going back to the Dot com bubble. In January of 2000 the NASDAQ was at 4069.31 and reached a peak on March 10, 2000, of 5048.62 by December 29th of that year your investment declined by -51% by the end of 2001 that decline was 61.37% and by the end of 2002 that decline was -73% from the peak. 3 negative years in a row. From January 1, 2000, to December 30th 2002 the actual decline was -67.08% for the 3 year period however keep in mind that many investors were putting money into their accounts on a regular basis thinking they would just dollar cost average the index. Yeah, it did not work out so well back then. It took 15 years before investors broke even.
So, what is our point, you cannot just blindly invest in a fund without knowing or understanding the basics and the underlying holding in those funds.
With every bubble we always see large groups of people that forget the simple stuff, the basics and think that this time it’s different. In the wake of every crash—whether it's the recent crypto, tech stocks or housing prices though out the country—you need understand the basics. If you are over 50 and want to have a cushion in retirement you need to take your portfolio off autopilot.
If 2023 is going to represent some return to common sense, then the best New Year’s resolution might be to take the time to understand exactly where your money is invested and what the real risks are that are associated with those investments. For those of you that are quickly approaching retirement or in retirement and still have your money in Index funds or ETF’s think about what your needs are. Most people that are invested in a bunch of funds generally have the dividends or capital gains reinvested into purchasing more shares of that specific fund, very rarely looking to see exactly what they made just that account values went up because they put more money into the fund doesn’t necessarily mean you had a good return. Those approaching or already in retirement need a different strategy than they had 20 years ago.
Income needs to be the focus and how to generate the most revenue without selling positions. Many people in index funds need to liquidate shares in order to meet their expense needs, so what happens in a year like 2022, when values go down and living expenses go up? The novice investor is required to sell more shares of the fund just to meet their needs. This typically causes a faster erosion of one’s portfolio and problems in the later part of their retirement years.
If you are paying a manager that is responsible for watching your money. Having a portfolio on autopilot simply because it works during bull markets, is a waste of money and won’t help you in this environment and may set you back a lot further than you think. Money can be made in any market environment, but not necessarily every year for professionals, however a good wealth manager will protect your portfolio and minimize your downside in these types of environments. While we cannot predict that 2023 will be good or bad just because we flipped the calendar does not mean that the economic conditions reset and everything goes to zero on January 1. If 2023 presents more challenges to investors that will mean that you will have 2 years of negative returns and two lost years of growth. So ask you self would you rather take a more conservative protective approach or get upset down the line because you kept the same strategy in place that have been proven does not work.
Job Numbers
Throughout all of 2022 we kept hearing that the jobs market was in good shape The government reconciles these numbers annually in early February. This year US payrolls figures will garner more attention than usual after early benchmarking work by a regional Federal Reserve bank (Philly Fed) suggest substantially weaker job growth in 2022 than official figures suggest.
The Bureau of Labor Statistics’ annual benchmark revision aims to better align its national employment count with state unemployment insurance tax records.
In mid-December economist at the Philadelphia Fed said their early benchmark estimate of the second quarter alone showed that “in the aggregate, 10,500 net new jobs were added during the period rather than the 1,121,500 jobs estimated by the sum of the states.” 10,000 is far from 1MM
We are supposed to have some of the smartest economist in the world working for the Fed and granted they rely on information provided by the States, but it seems like something is seriously wrong on so many levels
There are two surveys put out by the government every month: The Payroll which is the one that gets the headlines, and the Household Survey. The Payroll Survey only surveys large and medium-sized businesses and counts the number of jobs. The Household Survey calls on households and only asks if people in the household are employed.
A person holding two part-time jobs is counted as two in the Payroll Survey (number of jobs) but only as one in the Household Survey.
The Payroll Survey shows employment growth of nearly 2.7 million jobs between March and November of 2022. The Household Survey, over the same period, shows 12,000. Something is seriously wrong! The headline number that is broadcast in the media is the Payroll Survey, so if it is incorrect and the Household Survey is accurate, then the “hot” jobs market, which the Fed uses to justify its rate increases, is anything but hot.
The two surveys were in synch until March 2022, when the Payroll Survey took off. Some of the issue could revolve around the small business birth/death assumptions. We have addressed this in past articles. Since the Payroll Survey doesn’t sample small businesses, the Bureau of Labor Statistics (BLS) adds a number based on a time trend, and they even seasonally adjust this data.
During the March to November period, the Birth/Death model added 1.3 million jobs. This appears strange to any observer of economic trends, which tells us that business is contracting, not expanding. Even if the Birth/Death add-on is eliminated, the discrepancy is still 1.36 million jobs between the two surveys.
The Current Employment Statistics survey is used in the monthly employment reports and provides some of the earliest information about the state of the US economy. A major source of CES benchmark revision is the BLS’ Quarterly Census of Employment and Wages, which collects employment and wage data from states’ unemployment insurance tax records. While wider in scope, it’s more of a lagging indicator than leading.
In recent years, several regional Fed banks have conducted an early benchmarking to help policymakers track labor market conditions on a timely basis using quarterly data. It seems like a lot of people that we trust to make the best decisions for our country are not paying enough attention to the big picture and discrepancies in the math. Source https://www.bloomberg.com/news/articles/2022-12-20/early-benchmarking-of-us-labor-data-surprises-some-job-watchers?srnd=economics-indicators
Our Economic Outlook
Most of the pundits you hear in the media work for a financial institution and are looking to put a positive spin on the economic data. It makes sense since these institutions main objective is to gather as much money from investors as possible. That’s how they make money. You don’t want to give money to someone that is telling you things are looking bad, unless that person is going to protect you from the downside. The Government agency that is responsible for telling us the state of the economy in the United States is the National Bureau of Economic Research. We think that when the NBER gets around to deciding on the stat of the economy and date this Recession, Q1/22 will be the starting point. As the Real GDP data shows, that in 2022 we just experienced a flat (no growth) economy (at least through Q3). We think 2023 will contract as monetary policy acts with a lag, and we are just now seeing the tips of the icebergs: Remember every sing economic downturn is a result of bad decisions and we have made so many during the last two years on so many levels that it may just be time to pay for them
Here are some of the things we are looking at
Delinquencies are on the rise in the consumer loan, credit card, auto, and mortgage spaces.
Banks are experiencing deposit outflows and their new lending has slowed down to a crawl (+1.7% annualized rate from September to November vs. +12% at the end of 2021). (The Fed is paying Banks them 4.25%+, why lend in an environment where repayment is riskier)
Bloomberg recently reported that $650 billion of bonds and notes are in distressed condition.
The Conference Board’s Leading Economic Indicators (LEI) have fallen nine months in a row and in 10 of the last 11. History tells us that whenever such a negative pattern has occurred, 100% of the time a Recession follows. There is also a negative trend in the NY Fed’s weekly economic index (WEI) which uses 10 daily and weekly indicators or real economic activity.
Manufacturing has slowed and soon will be in contraction. Industrial Production in November only grew because utility output was up because of unseasonably cold weather. The ISM Mfg. Index is also on a downward slope
The money supply, always critical to the economy’s growth, has grown 0% on a Y/Y basis (after double digit (inflationary) growth in 2020 and 2021) and is destined to turn negative as the Fed continues its Quantitative Tightening (QT), selling Treasuries and Mortgaged Backed Securities from its portfolio and reducing bank reserves (another reason bank lending is disappearing).
Fed-Ex recently reported a -10% Y/Y fall in their average daily delivery volumes in 2022, not good news for retailers. On the positive side, there has been an easing of the labor constraint as “on-time” performance in 2022 has risen to 95.3% from 83.9% in 2021.
Maersk, the large worldwide shipping company, has forecast that container demand will fall -4% in 2023.
Retail inventories are +19.8% higher than a year ago; So we expect heavy discounting in the months ahead (a positive sign for inflation!).
Challenger Gray and Christmas reported significantly rising layoffs. On Thursday (December 29) the Department of Labor’s weekly release showed that for the week of December 17, insured unemployment rose 41K to 1.71 million. And while most don’t care about Wall Street powerhouse Goldman Sachs has announced layoffs possibly as high as 8% of their staff.
All the Regional Federal Reserve Bank Surveys are reporting much weaker hiring trends. A composite of those employment indexes now stands at -2.2 (December), the first time this composite has been negative since the May 2020 lockdowns.
Finally Housing which is the most interest sensitive sector. The latest data confirms that housing is already in Recession based on pending home sales. November came in at -4.0% M/M and October was also down -4.7%. On a Y/Y basis, pending home sales are down a whopping -38.6%. This is the largest Y/Y decline in the 20-year history of the index. Housing is also a significant part of our economy, all of the workers involved and products involved in housing, from furniture to appliances to paint and landscaping. Many people will be experiencing a loss on income from the decline. Source Economist Bob Barone
While some of the information in this blog has a negative tone it is not our intention to scare anyone, but rather give you some information so you can make better and more thoughtful investment decisions. Finance and investing are complicated, it often involves emotional reactions as well as logical ones. Our intent is to help you become more involved in the way your money is invested and to not blindly take direction. To think things through on information you hear and if they make any sense. The markets are like an irrational animal anyway you look at it, but you can develop a strategy that protects your downside in an environment like this.
The Week Ahead
As a new year begins, investors and policymakers are still at odds on several key questions. What level will interest rates peak? How persistent will inflation be? And lastly, will the U.S. experience a recession? Last year’s interest rate shock was brutal for growth stocks, bonds, and the housing market, but more pain could filter into other areas like corporate earnings, private equity, and commercial real estate. This week, after today’s observed New Year’s Day holiday, a busy economic calendar awaits, highlighted by the U.S. jobs data. The Fed is waiting for that elusive labor market slowdown, with December payrolls expected to grow, which we know will be inaccurate. Minutes from the last FOMC meeting will be closely scrutinized on Wednesday given the recent lack of commentary from committee members. U.S. ISM PMIs will also be released, with manufacturing on Wednesday followed by services on Friday.
Overseas, December’s flash estimate for Eurozone CPI is expected to moderate, raising hopes that inflation has peaked, although the central bank remains unconvinced. Finally, China’s private sector PMIs will follow the government’s official results from the weekend as the country battles a surge in Covid infections.
This article is provided by Gene Witt of FourStar Wealth Advisors, LLC (“FourStar” or the “Firm”) for general informational purposes only. This information is not considered to be an offer to buy or sell any securities or investments. Investing involves the risk of loss and investors should be prepared to bear potential losses. Investments should only be made after thorough review with your investment advisor, considering all factors including personal goals, needs and risk tolerance. FourStar is a SEC registered investment adviser that maintains a principal place of business in the State of Illinois. The Firm may only transact business in those states in which it is notice filed or qualifies for a corresponding exemption from such requirements. For information about FourStar’s registration status and business operations, please consult the Firm’s Form ADV disclosure documents, the most recent versions of which are available on the SEC’s Investment Adviser Public Disclosure website at www.adviserinfo.sec.gov/
The Optimized Investor
