
First Week of the New Year
Market and Economic Review
for the week ending Jan 6th 2023

The content of this Newsletter is to provide you with Economic insights to assist you in making better decisions with your investments. Unlike many other financial periodicals we will not mention specific companies, unless it is relevant to an overall economic issue. We welcome your questions on economic concerns and will address in our newsletter. just email us at info@optfinancialstrategies.com #FinancialAdvisor,#investmentmanagement #wealthmanagement #financialplanning #retirementplanning #401kplans
Market Week in Review
2023 is coming off a year in which S&P 500 (the benchmark for the market) slid more than 19% with climbing inflation numbers this prompted the Federal Reserve's FOMC to raise its lending rate seven times. With concerns of a recession, many investors have been hoping the rate increases would slow and eventually lead to rates being reduced, but the FOMC raised its median rate outlook at its final meeting of 2022 and the first few days of the year continued with the same sentiment we ended the year.
The first few days of trading of the New Year continued with more concerns about the direction of the economy. With all Indices down for the first 3 days of the week. As of Thursday’s market, close, the S&P index was below last Friday's Dec 30th close, but a 2.3% rally on Friday came on the December jobs data sending the S&P 500 into positive territory for the week. The DOW jumped more than 700 points on Friday the NASDAQ +264 and the Russell 2000 +39 giving all the indices a positive upward movement for the week. The NASDAQ had the lowest increase at just under 1% The Russell 2000 ended the week up the most with a 1.79% increase followed by the DOW and S&P coming in at 1.46% and 1.45% respectively.
Also, last week we got a deeper look at the minutes from the December FOMC meeting. The minutes disclosed that the committee's participants indicated that they expected higher interest rates to remain in place for "some time." In addition, "no participants anticipated that it would be appropriate to begin reducing the federal funds rate target in 2023," which gave investors concern. This year we are also added the 2-year Treasury to our list of information. Historically when the 2yr and 10yr. treasury are inverted we have had a recession. It’s been inverted for just under a year, but the purpose is t keep an eye on the difference to show signs of when the markets feel economy will shift directions.Week In Review
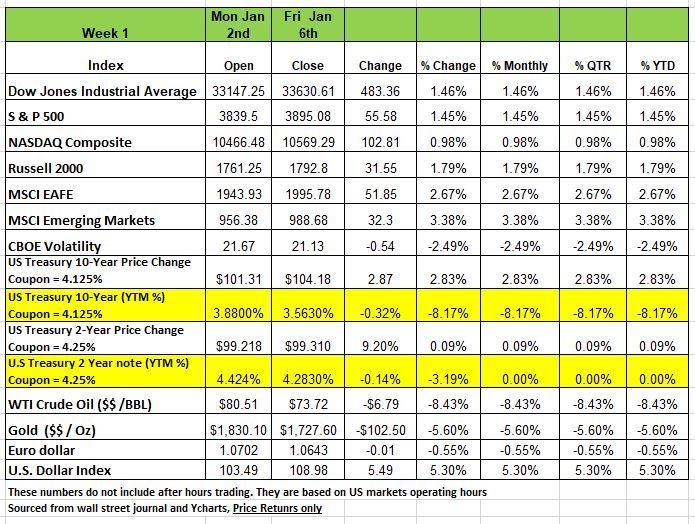
.U.S. Treasury yields sank along with the U.S. dollar after Friday’s non-farm payrolls for December showed slowing wage growth despite historically low unemployment and solid job gains.
One would think that, since the labor market appears to be so strong, this would elicit a further hawkish response from the Fed, and that interest rates would spike higher. But the opposite occurred with the 10-Yr. Treasury yield falling more than 16 basis points (to 3.56% from 3.72% on Thursday) and even short-term rates tumbled significantly (the 2-Yr. Treasury plunged nearly 20 basis points to 4.26%). Something appears to be out of whack
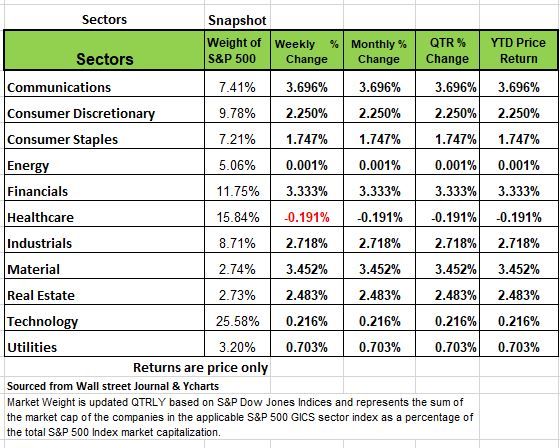
All sectors were up this week except one, Healthcare had a negative decline -.191% Communications Materials and Financials all had +3% gains followed by Industrials Real Estate and consumer Discretionary. Energy Utilities and technology pulled up the rear on the first week of trading for 2023.
Crude oil sank 8.5% as demand concerns lingered, while gold prices gained 2.3% to reach a 7-month high.
U.S. manufacturing shrank for a second straight month, with the ISM prices index plunging to the bottom 5% of all periods, after having recently reached the highest levels in 40 years. Services activity plummeted into contraction territory for the first time in 2.5+ years, offering more evidence that inflation is moderating.
U.S. factory orders also fell in November, led by a 2.1% decline in durable goods. Although minutes from the December FOMC meeting expressed a hawkish tone, last week’s data gave investors some optimism.
Internationally, Eurozone inflation dropped for a second consecutive month in December, but with CPI at +9.2% YoY, the central bank’s path towards higher rates is unlikely to change.
In China, business activity remained weak in December, and the country planned to relax restrictions on developer borrowing to further bolster the beleaguered real estate sector.
Sector Weighting
So how much did things change in 2022? The S&P 500 is made of if 11 sectors these sectors pretty much span all the industries that make up our economy. We thought we would take a closer look at one specific change that may be impacting your portfolio, especially if you’re an index investor. If you are maybe, we should be doing a better job of educating you.
The S&P 500 is not equally weighted. As you can see by the chart below each sector has just so much influence on the movement of the S&P 500. Companies with large market caps in each sector tend to move the sector and market more than others. Apple Tesla and Meta (AKA Facebook) are just a few names. Approximately 39 companies have a weight of .5% to 5.9% of the movement of the S&P Index. Apple and Microsoft carry the most influence with both over 5% Amazon is a distant 3rd with a 2.3% factor. So, when these companies do poorly the sectors also do poorly and change the weighting of the Index. In the chart below you can see each sectors weight for most of 2022 compare this to how the weights have changed since the end of the yearNew Paragraph
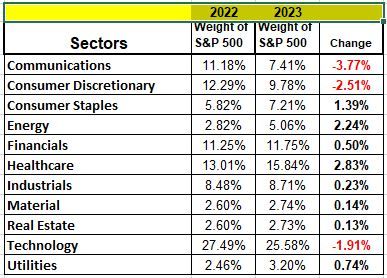
Communications, Consumer Discretionary and Technology have all dropped considerably. But sectors such as Energy, Healthcare and Consumer Staples have all increased their weight on the index. We share this because contrary to what many believe you need to be aware of your exposure to these sectors and if the economy continues to unravel then be aware of those sectors that should do well 20 2323.
Employment Numbers A Closer Look
We have often voiced our option that the media tends to sensationalize information and often mislead the public. We think its prudent to take the time necessary to look beneath the headlines, especially at relevant data that the media ignores, so that you do not make bad decision based on misinformation. It would be wise to do that with this specific employment number. The headline Payroll number was +223K (Seasonally Adjusted). Last week we addressed the season adjustment number for 2022 being pegged by the Philly Fed as overshooting the actual number by 1.5MM jobs
The Birth/Death model (an unconfirmed used when accounting for small businesses) add-on was +79K. In addition, the November jobs number was revised down by -28K (It’s likely earlier months will also be revised down when the annual revisions are revealed in early February). As a result, the net change in jobs that were actually counted by the BLS was +116K. While still positive it’s a difference of 107 jobs that did not really exist. Not quite the same headline.
It’s also important to note that the number of jobs, while important, doesn’t tell the entire employment story because, while the Payroll Survey counts the number of jobs, it doesn’t distinguish between full-time and part-time jobs or hours worked. The total number of jobs may rise, but if they are all part-time, and if hours worked fall, then economic activity declines. This is what happened in both November and December. Last month hours worked fell -0.3%. That small percentage doesn’t seem like a lot, but when spread over 159 million people employed, that’s a lot of hours. Economist David Rosenberg, calculated that when hours worked are taken into account, the equivalent number of jobs fell -150K in December (and by -300K in November). Looking elsewhere for corroborating evidence, we find that the factory workweek fell -0.25% in December and has been flat or down in every month since February.
The Unemployment Rate
The Unemployment Rate (U3) fell from 3.7% to 3.5%. Wouldn’t that also be a sign of labor force strength? Again, let’s examine the detail. The U3 is calculated from the Household Survey which counts people that are employed. That is, if you are “employed” you are counted as one even if you hold more than one job. In the December report, there was no net increase in full-time jobs, but part-time jobs grew +679K! This tells us that the growth in the number of jobs in the payroll report (i.e., the +223K) was all part-time. 5.1% of the workforce now have two jobs. That’s up from 4.7% in October and is a sign of distress in the labor market, not a sign of strength. In addition, the recent rise we’ve seen in credit card debt is more evidence that people are not working enough to pay their bills and carrying more debt.
Other Indicators
Indeed, the “strong” labor market, “soft-landing” narrative is not backed-up by other data.
If the labor market were as tight as suggested by the media or by the Payroll number alone, then the softening of the growth in wages discussed above would not be happening, i.e., we would expect wages to be accelerating, not decelerating!
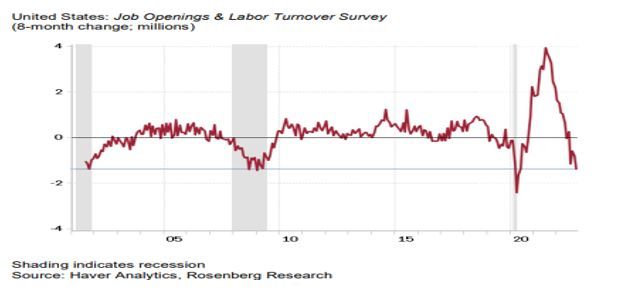
The chart above shows the eight month change in job openings in the JOLTS (Job Openings and Labor Turnover Survey), a favorite of Fed Chair Powell. This kind of behavior has only occurred in Recessions.
Layoff announcements have been accelerating and are now a daily event. If things were so tight, then the layoff numbers would not be so high at many companies across all sectors. The Technology sector, which is considered America’s growth industry, has dominated the layoff headlines.
Layoffs.fyi a website that tracks the technology sector has calculated that last year 1,018 tech companies laid off nearly 154,000 employees; this compares to 80,000 layoffs from March-December 2020, and 15,000 in all of 2021. So far in 2023 they have 18,000 layoffs measured https://layoffs.fyi/
Another sign of distress in the labor market comes from the head-hunters themselves. Temp Agency employment is a solid leading indicator for employment. Employment in this industry fell -35K in December and is down five months in a row (by -111K). Think about what this means. When the head-hunters are chopping their own heads, it means that job openings are drying up.
So the big question is how can the employment numbers be so good if there are so many layoffs across the economy?
The ISM Manufacturing Survey came in at 48.4 in December vs. 49.0 in November, both numbers below the demarcation line of 50 between growth and contraction and a composite from the Regional Federal Reserve Bank Manufacturing Surveys of new orders, production and employment has now dipped below zero.
To go along with the softer than expected growth in wages mentioned at the top of this commentary the softer tones in the PCE, PPI and CPI measures of inflation, the ISM survey of prices paid in the manufacturing sector (Dec was 39.4 vs. Nov 43.0) is approaching the lows reached during the Covid lockdowns in April 2020. Clearly disinflationary.
The Recession in real estate goes much deeper than just housing. According to Rosenberg Research, there are 212 million square feet of sub-lease space available, the highest ever recorded and nearly double the 109 million square feet available at the end of 2019. Clearly many businesses are struggling with revenue and expenses.
Over the last six months, rents in some once hot markets have fallen: by -3% in Las Vegas, by -2% in Phoenix, and by -1% in Tampa. Part of the reason is the 400K new apartment units that came on the market in 2022. Given that 2023 is on track to produce more than 500K new units, rents have a considerable distance to fall, and that will play a role in steering monetary policy in this year’s second half of the year. Remember that housing rent is 30% of the calculation of CPI as rents recede so will the inflation numbers.
The Fed states that it will be making decisions based on incoming data, so as the numbers continue to unravel and inflation spirals down the Fed should react accordingly. Let’s just hope it does not take them too long to do so. Source Economist Bob Barone
A Technical Perspective
For those new readers to our newsletter technical analysis is an investment strategy /trading discipline that relies on identifying opportunities by analyzing statistical trends gathered from trading activity, such as price movement and volume. While no one can identify the bottom and peak price of a security, technical analysis tries to identify opportunities close to it.
The January Barometer
There is an old saying amongst traders and you may be hearing the phrase or something similar to it over the next few weeks “so goes January, so goes the year.”
The old trading adage was developed in 1972 by Yale Hirsch, author of the “The Stock Trader’s Almanac.” The whole premise behind the “January Barometer” is that if January is an up month, then the market will end up for the year. The theory also places emphasis on the first five trading days of the new year. If the first five days of the year are up, then there is a higher likelihood of the calendar year ending up.
The January Barometer naturally has some critics, we are one of them. There just isn’t enough data points to support the theory as anything other than pure coincidence. Nonetheless, it does give the news something to talk about. No one has a working crystal ball. The first five days of January did end up for the S&P 500. What is funny about that is that most all of that came from a +2.25% single up-day on Friday. Almost every other day last week opened to the upside, before a wave of selling kicked in.
A bear market doesn’t flip at midnight of a new year. A bear market is marked by high volatility. Large “up” days have been just as frequent as large “down” days. Disregard seasonal trends, and don’t get hung up in why the market goes up or down on any given day. Bear markets can make rational investors make irrational decisions.
Market leadership in 2022 stacked up in reverse from what it was in 2021. Pay attention to what is going on and which indices are performing well. In a healthy market, the Nasdaq would generally lead the pack followed by the S&P 500, and then the Dow Jones. That was the case in 2021 and other years. However, in 2022, the opposite occurred. The Dow outperformed the technology-heavy Nasdaq and had about half of the volatility. As a result, sector leadership has flipped from what it had been in years prior to 2022. Out of 11 US sectors, Industrials, Energy, and Financials held the top spots on risk adjusted rankings. Meanwhile, Information Technology, Communications, and Consumer Discretionary (which has heavy exposure to Amazon and Tesla) round out the bottom of the sector ranks.
Fortunately, with all the innovative investment tools available today, such as ETFs, Portfolio Management can include more than just the US markets. Our system generates investment reports on more than 200 ETFs (Exchange-Traded-Funds). Looking at the top risk adjusted rankings of these funds, nine of the top eleven are internationally based ETFs. Meaning that international markets are showing risk-adjusted strength compared to US markets to begin 2023. Source Brandon Bischoff
The Week Ahead
A typical less dense calendar awaits following the U.S. labor market reports, but there are a few major announcements stacked towards this week’s end. The debate over the size of the Fed’s next rate hike may well come down to December’s U.S. CPI report on Thursday. Expectations are for prices to have cooled further from the prior month, but the Fed may still lean towards a second straight half-point increase at the February meeting. That said, traders are currently wagering 75% odds of only a 25bps hike, according to fed funds futures. For investors, after 10+ years of little alternatives to stocks, the 3-month Treasury bill is now yielding 4.52%, a full percentage point more than 10-year notes. This type of yield inversion has occurred before each of the last 8 U.S. recessions, with a usual lag of 12 to 18 months. On Tuesday, Fed Chair Powell and other global central bankers will speak at an international symposium in Stockholm. Other U.S. events of note include consumer credit and sentiment, while Q4 earnings season gets underway with results from JP Morgan, Bank of America, and Citigroup. Overseas, China’s consumer and producer prices are forecasted for slight upticks but remain well below the rest of the developed world, while Australia’s CPI is expected to outpace the prior month’s reading. Across the pond, the UK releases monthly GDP figures on Friday, and a quiet week in Europe is highlighted by German industrial production and Eurozone investor confidence.
This article is provided by Gene Witt of FourStar Wealth Advisors, LLC (“FourStar” or the “Firm”) for general informational purposes only. This information is not considered to be an offer to buy or sell any securities or investments. Investing involves the risk of loss and investors should be prepared to bear potential losses. Investments should only be made after thorough review with your investment advisor, considering all factors including personal goals, needs and risk tolerance. FourStar is a SEC registered investment adviser that maintains a principal place of business in the State of Illinois. The Firm may only transact business in those states in which it is notice filed or qualifies for a corresponding exemption from such requirements. For information about FourStar’s registration status and business operations, please consult the Firm’s Form ADV disclosure documents, the most recent versions of which are available on the SEC’s Investment Adviser Public Disclosure website at www.adviserinfo.sec.gov/
The Optimized Investor
