
Housing, Labor, Inflation & Other Economic News
Week Ending May 21st 2021

OverView
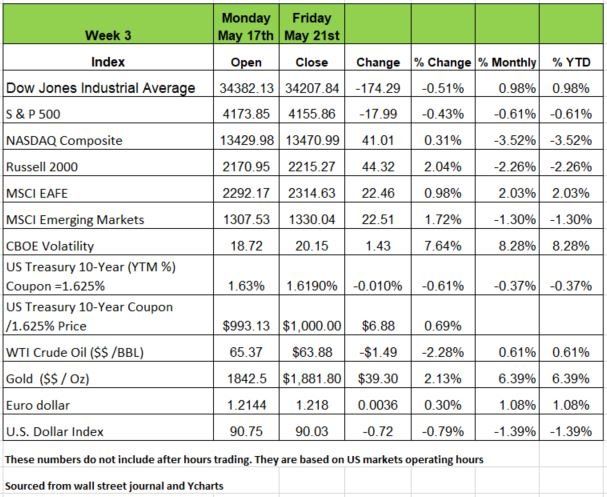
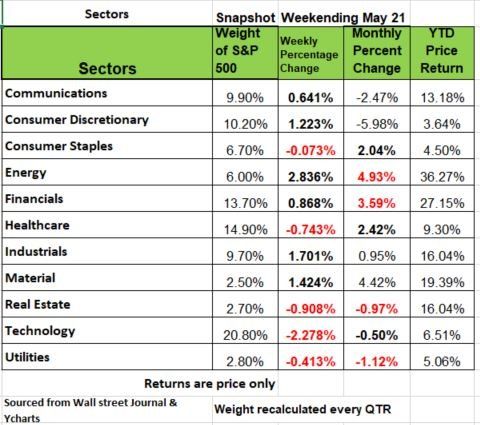
We are in the middle of the 5th in Calendar year 2021 and have 3 of the 4 major indices down for the year. The Dow just up .98% YTD. (These figures are price returns only) All of the major sectors are in positive territory with Energy and Financials leading the way followed by Industrial Materials and Real Estate.
For the last 14 months we have heard a lot of narratives about how the economy will behave/rebound. We started using letters of the alphabet as a metaphor to describe what will happen. Economics, simply put is a study of how people behave with money. So here is what we know and have learned. The government has spent Trillions of dollars to support the economy and provide Americans with a safety net. That safety net was not in the form of jobs but basically free money. The net result was an $500 billion drop in GDP or -2.3% in 2020.
For Q1 of 2021 we saw major increase in numbers when the new administration took over. The American Rescue Plan Act infused a few more Trillion dollars in to the system and that is reflected in the $610 billion increase PCE (personal consumption expenditures)
Americans have taken that money and used it in many different ways. There is a direct correlation to an increase in retail sales and the distribution of funds from the IRS. The $1400 check went directly to spending of consumer discretionary. We know this because retail sales in April fell -.07% Month over Month expectation were +1.0% that is a big miss in the retail world.
In many parts of the country, no more masks are required! Businesses reopening. And, it sure does look like the impact of the latest stimulus checks (helicopter money) faded fast.
The “core” figure that is used in the GDP calculations fell -1.5% for April, the first month of Q2, not a good omen for GDP growth moving forward. That likely means that the high single digit and some double-digit forecasts for Q2 GDP growth will soon come tumbling back to earth. How the market reacts to this may surprise those with portfolios on autopilot.
The University of Michigan’s Consumer Sentiment Survey threw more cold water on the “boom” mentality. The overall survey retreated from 88.3 in April to 82.8 in May. The fall in sentiment was across every social stratum and through every age group.
One concern is that auto buying plans fell hard to 102 from 118, the lowest level since October 2008. But, the biggest fall in sentiment occurred in home buying plans which crashed to 95 in May from 114 in April and 127 in March. The May reading was the lowest in 38 years!!!
It appears we have not only run out of supply, as well as an increase in home prices and interest rates. New home construction has stalled until materials cost come down due to supply shortages
How covid-19 triggered America’s first female recession in 50 years
Historically past recessions have hit men the hardest, mostly because those jobs impacted most by recessions because of more males dominated industries like construction and manufacturing. In addition, women have only stated having a presence in the work force since the mid to late 70’s.
In the recession of 2008-09, for example, men accounted for some three-quarters of American job losses. The most recent downturn, by contrast, has weighed on female-dominated sectors, such as retail and hospitality. Last year the share of women on American payrolls fell from 50% in March 2020 to 49.1% two months later, before inching back up to 49.8% today.
Recently, three economists at the Federal Reserve Bank of San Francisco issued a paper suggesting that some of the disparity can be explained by differences in parental responsibilities. With children at home due to school closures and remote learning, more women took up the responsibility of managing their children ensuring that the paid attention to the online classes.
Using monthly data from the Census Bureau’s Current Population Survey, the researchers analyzed the labor-market outcomes of four groups of prime-age workers (those aged from 25 to 54): mothers; fathers; women without children; and men without children. The result showed that Mom’s employment rates dropped -7%. Especially with mothers with children under the age of 5 Source ttps://www.economist.com/graphic-detail/2021/03/08/how-covid-19-triggered-americas-first-female-recession-in-50-years?itm_source=parsely-api
Prioritize your debt
With all of the Stimulus money, mortgage forbearance and the pause in federal student loans many Americans have paid down pay down high-interest credit-card debt. Now, some are wondering what is the smartest debt to pay off next.
More than $82.9 billion of credit-card debt has been paid down in 2020, according to an analysis of TransUnion and Federal Reserve data by WalletHub.com. In the first quarter of 2021, credit-card balances dropped by $49 billion, the second-largest quarterly decline since 1999, according to the Federal Reserve Bank of New York. Meanwhile, more than 20 million people still have student loans in forbearance. What many probably do not realize is that forbearance is not forgiveness and while mortgages may be tacked on to the back end of a mortgage contract, rent is not. Those that have avoided paying rent should by all means make every effort right now to pay back this obligation. Landlords will begin evicting regardless of how think the rental market is. But more importantly have the blemish on your credit report will impact future abilities to borrow and increase interest rates on credit cards. Source https://www.wsj.com/articles/after-credit-cards-which-debt-should-you-pay-11621519201
Rescue the muni market
Shortly after the onset of the COVID-19 crisis, there were concerns that issuers of municipal bonds would face a tsunami of downgrades and potentially defaults. That didn’t happen. It didn’t happen because the crisis had a disproportionate impact on different parts of the economy, and due to the swift and substantial fiscal support.
Since March 2020, there have been six separate bills totaling about $5.3 trillion. The most recent one, the American Rescue Plan (ARP), is a game changer for the muni market. The bill provides a large amount of direct aid for many different types of municipal issuers, as well as several provisions that should support economic growth and indirectly support many muni issuers. It's not all rosy for the muni market, though. Although the risk for a wave of downgrades has waned, yields are low relative to comparable alternatives. Some investors are adding moderately lower rated investment grade muni exposure as they provide more attractive yields than the higher rated part of the investment grade muni market.
More insight to Inflation
So does inflation have you concerned? While inflation is running a little hot. It's not a real surprise. But, is it transitory and temporary, or is it real and here for the longer term? How high will the Federal Reserve let it go, and for how long? When does transitory and cyclical become "secular" and "serious"? These are important questions and need to be concerned on when making big purchasing decisions. because our budgets will get blown out of whack
In April, the CPI was up 4.2% from a year ago; producer prices were up 6.2%. The "core" measures for each of these indexes are running at 3.0% and 4.6%, respectively. But remember last April we were in shut down mode and many companies just liquidated inventories at lower prices.
The Federal Reserve focuses on the inflation measure for personal consumption expenditures (PCE), which should be up about 3.4% versus a year ago once we get the April data, which is scheduled to arrive this Friday.
The Fed has said that the recent pressures are "transitory," caused by supply-chain issues that should go away as the economy continues to recover. However, the fact that employment continues to be high and that companies can’t find workers is also putting pressure on wage increases. How this will translate into long term will be seen in the fall when the helicopter money is supposed to stop.
Clearly, the Fed is dismissing the surge in inflation this year. And Fed forecasts show that it expects inflation to fall back down to it's 2.0% target in 2022 and beyond. But if the Fed is wrong the way to control inflation is to raise interest rates which is typically the tool the Fed uses, but if that happens its surely will be harmful.
Housing Data
If you have been reading or watching the news, you know, home prices have skyrocketed. The sector has a 12% Y/Y growth. The latest data, however, have accelerated and the M/M price increases are at a rate closer to 15% annualized.
Supply chain issues, due to the pandemic, have put building materials in short supply, and labor also appears to be in short supply (unemployment benefit disincentives?). Those have caused upward price spikes. In addition, in the existing housing space, the single-family unit is now the rage as work from home (WFH) put a premium on this form of housing. In some markets, existing home for-sale listings last less than a day, and bidding wars result in prices paid being higher than the original asking price and the appraisal.
The good news is that the supply chains are loosening. As reported in our past blogs, Canada’s lumber industry has shifted into high gear. We believe that much of the price frenzy has been caused by speculative fervor in the commodity pits as opposed to actual supply/demand. Nevertheless, the speculation does have a large influence on commodity prices, like lumber. We have recently witnessed some speculative retreats (Bitcoin!) and commodities have not been excluded. The chart below shows the wild ride the price of lumber has taken in the CME commodity pits this year
Labor Markets
So what is really going on?
Initial Unemployment Claims (ICs) continue to creep down, falling to +455K the week ended May 15 from +492K the prior week, a fall of about -37 from the prior week.
While there is a continued downtrend, keep in mind that ICs are a proxy for layoffs, and +455K still represents a number we would only expect in a severe recession. In addition, the special Pandemic Unemployment Assistance (PUA) programs, ICs fell from +104K to +95K.
The people in these programs are owners of small businesses, and the number of new filings here are a proxy for small business closures. Adding the two IC numbers together results in +550K new claimants (chart). The pre-pandemic “normal” was +200K, so, the main excitement here is that ICs continue to fall.
Another concern remains the level of Continuing Unemployment Claims (CCs) (those receiving benefits for more than a week). These showed up as 16.0 million the week of May 1, down about -900K from the prior week. Nearly all the fall was in the PUA programs which we interpret to mean that small businesses reopened with those business owners returning to work and falling off the unemployment roles.
However, the state numbers aren’t moving as fast. Why? Well, the increase in benefits under the Rescue Act are hurting many businesses trying to open, unable to meet their staffing needs. Why get off the couch if you can make the same amount of money for not doing anything. Ok that may apply to some sectors like hotels and restaurants, But what about the IC? Why are new unemployment claims still so high while employers can’t get staff? The best explanation we have is fraud. The IC numbers are not being check or verified and the tax payers are footing the bill. These claims have been going on for a while so it may be difficult to get real accurate information on the true labor situation.
The week Ahead
The economic calendar is light until Thursday, when we’ll get a second look at U.S. Q1 GDP, where no change is expected from the initial estimate of +6.4%. (annualized) The monthly durable goods report should offer a glimpse into how supply chains are coping with the confluence of material shortages and strong consumer demand. Pending home sales may follow last week’s cooling trend, while unemployment claims are anticipated to fall again.
On Friday the Fed’s preferred measure of inflation, the PCE Price Index, will provide another check on spending behavior, and Chicago PMI rounds out the month ahead of Memorial Day weekend.
This article is provided by Gene Witt of FourStar Wealth Advisors, LLC (“FourStar” or the “Firm”) for general informational purposes only. This information is not considered to be an offer to buy or sell any securities or investments. Investing involves the risk of loss and investors should be prepared to bear potential losses. Investments should only be made after thorough review with your investment advisor, considering all factors including personal goals, needs and risk tolerance. FourStar is a SEC registered investment adviser that maintains a principal place of business in the State of Illinois. The Firm may only transact business in those states in which it is notice filed or qualifies for a corresponding exemption from such requirements. For information about FourStar’s registration status and business operations, please consult the Firm’s Form ADV disclosure documents, the most recent versions of which are available on the SEC’s Investment Adviser Public Disclosure website at www.adviserinfo.sec.gov/
The Optimized Investor