
Fasten Your Seatbelts, An Economic & Weekly Market Recap
for the week of Dec 12th 2022

The content of this Newsletter is to provide you with Economic insights to assist you in making better decisions with your investments. Unlike many other financial periodicals we will not mention specific companies, unless it is relevant to an overall economic issue. We welcome your questions on economic concerns and will address in our newsletter. just email us at info@optfinancialstrategies.com #FinancialAdvisor,#investmentmanagement #wealthmanagement #financialplanning #retirementplanning #401kplans
Recap of Last Week
The markets performed poorly last week as all 4 indices were down significantly. The largest decline came was seen in the Russell 2000 with a -5.08% followed by the NASDAQ with a -3.99% followed by the S&P 500 index dropping -3.4% and the DOW -2.77% and as investors worried that a recent round of better-than-expected economic data might prompt the Federal Reserve to keep its key rate higher for longer. On a YTD basis only the DOW is showing a negative return below -10%
The weekly decline came as several economic reports over the last week came in stronger than expected. A November reading on the services sector from the Institute for Supply Management as well as a December reading on consumer sentiment from the University of Michigan both came in above expectations this week. They followed a stronger-than-expected November employment data released last Friday.
Investors are fearful that if economic data continue to come in above expectations, the Fed's Federal Open Market Committee - which has a two-day meeting next week - may keep its benchmark lending rate higher for longer as it continues trying to tamp down inflation.
Still, not all data came in stronger than expected. Weekly jobless claims released Thursday showed US jobless claims increased by 4,000 to 230,000 in the week ended Dec. 3, and continuing claims advanced to 1.67 million from 1.61 million, marking the highest level of continuing claims since February.
On Friday, a larger-than-expected rise in US producer prices in November only added to investors' worries about rates and inflation. The core Producer Price Index for November rose by 0.4%, double the 0.2% rise that was expected and quadruple the previous month's 0.1% increase.
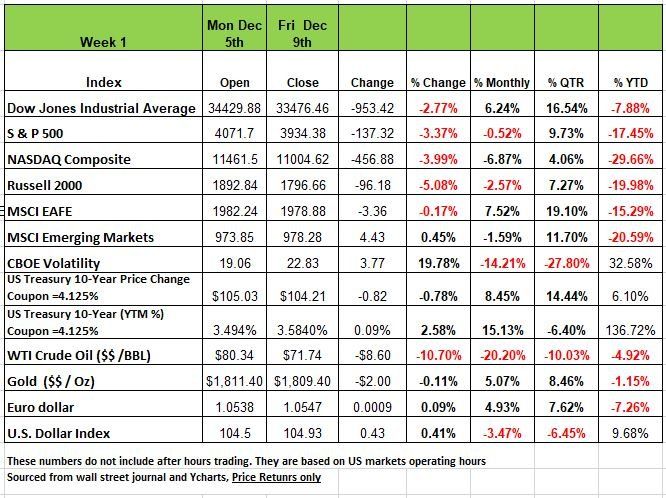
On October 18, the 10-Yr Treasury Bond was yielding 4.226% on a coupon of 4.125%. It fell to 3.408% on Tuesday (December 6) and closed at 3.587% on Friday. This is a result of the price of Treasuries increasing. As investors have more concern for security in their investment, they are willing to pay more and get less.
Short-term rates which are closely tied to the Federal Funds rate, the administered rate set by the Federal Reserve, currently 3.75%-4.00%, but expected to rise to 4.25%-4.50% after the Fed’s meeting this week (Dec 13-14). The two-year Treasury rate peaked on November 2 at 4.701% and closed on Friday at 4.344%. The economic data that the media and the Fed is focusing on is causing investors to be concerned about the trajectory of the Feds rates.
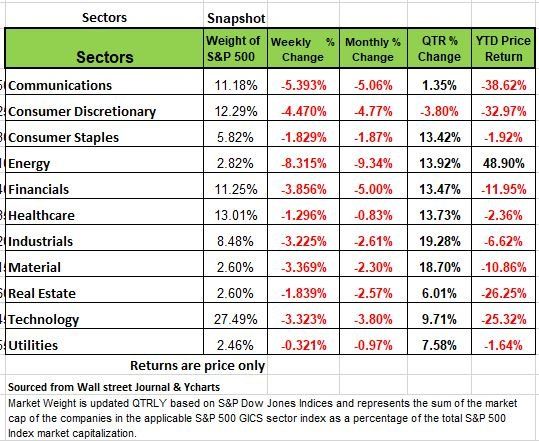
All the S&P 500's sectors fell last week. Energy had the largest percentage drop, down 8.3%, followed by communication services, which slid 5.4%, and consumer discretionary, which fell 4.5%. Other decliners included financials, down 3.9%; and technology and materials, which slipped 3.3% each. The smallest decline came from utilities, which edged down 0.3%.
The energy sector's slide came as futures in crude oil and natural gas fell. The utilities sector's slim decline came amid gainers in the sector
On Monday, Factory orders, durable goods orders and the ISM services index all were higher than analyst expectations, along with news that China may be easing covid restrictions. Strong labor reports, especially within the service sector, have led investors to speculate that additional rate hikes may be required in 2023. U.S. producer price index rose 0.3% for November, compared to expectations of 0.2%, showing investors that inflation may still be running hot. The market implied probability of a 50-basis-point increase from the Federal Reserve at the December 14th meeting remain about the same, but the implied rate by the end of 2023 increased 10-basis-points. Oil ended the week down 11%.
This week, all eyes will be on the FOMC's two-day meeting, which concludes on Wednesday. Other focal points on the economic calendar include the release of the November consumer price index on Tuesday, November retail sales on Thursday, and December readings on the manufacturing and services sectors from Standard & Poor's on Friday.
Fasten your Seat Belts
There is no shortage of opinions on the state of the economy. On Sunday night Treasury Secretary Janet Yellen spoken on 60 minutes and had a positive outlook for 2023, However Ms. Yellen doesn’t exactly have the best track record. She did not see the housing crash in 2008, She was wrong about inflation because of all the money the government sent, so we do not put a lot of weight on her options. But she is not alone, it seems like half of the economist are saying we can avoid a recession and the other half is split between whether it will be a hard landing or a soft landing. The media is focused on the sizzle for the moment and the government seems to be compromised to the point where independent agencies can’t even be clear about the numbers they release. Information should be present in a manner that allows the public to understand the real condition of the economy if only to brace them for what may be a serious economic shock. As we have stated in past article all economic downturns, “recessions” are a result of bad decisions and when the pandemic hit our government made so many that we believe the result will be painful for many Americans
So why do we think we are headed for rough waters? Let’s look at some indicators, leading indicators no lagging indicators that the Federal Reserve seems to be focused on. Historically recessions have been defined as 2 quarters of reduced/negative GDP. We experienced this is the first part of 2022 with Q1 & Q2 having -1.6% and -.06% decreases. Q3 came in with a positive number +.04% Quarter over Quarter. However, keep in mind that the U.S. dollars rose in value by over 8% which had a significant impact on NE (net exports /imports).
Because unemployment has been so low many pundits are arguing that we are not in a recession, but even these numbers seem to be clouded. When we hear that new jobs have been added we generally do not hear they type of job or the number of hours associated with the job, we make the assumption that it is full time at 40 hours. But when we look closer at the numbers something the media refuses to acknowledge we find that most of the jobs are part time and when we evaluate the household surveys done by the government, we find that one person has 2 part time jobs but are counted twice in the job’s numbers. Not exactly what we would call a healthy economic environment. But more concerning is the decline in the average hours worked, which is below 34, this would equate to a loss of approximately -380K jobs. A downward move of this magnitude is like what we experienced in 2001 during the Dotcom bubble and the 2008 financial crisis.
Another signal that we are in a down economic environment is the yield curve between the 10-year Treasury and the 2-year. Under normal healthy economic conditions, the yield on the 10-year would be larger that that of the 2-year. It makes sense since you’re giving your money away for a longer period and want a larger return. However, when the 2 years yield exceeds the 10 year (an inversion) it is because the markets believe there is more inherent risk in longer term securities. Today’s difference between the 2-Yr and the 10-Yr is yield is -0.75 pct. points (-75 basis points (bps)), a very large negative spread. Over the years, such inversions have been very accurate indicators of an oncoming Recession, especially when the inversion is of large magnitude like this one. The yield curve has been inverted for most of the 2022. Historically when we have such an inversion, we have always experienced some economic pain. The spread in today’s yield curve inversion is the largest one since Paul Volcker was Fed Chair in the early ‘80s. You can listen to the wanna be experts on you tube or tic tok and gamble your money, but we think it is unlikely that the economy is avoiding a Recession, and more unlikely that it will be mild. Unfortunately, we will have to wait for the National Bureau of Economic Research to get around to setting Recession dates and are confident 2022 will be the start of it.
Other disturbing indicators include the rapid rise in revolving consumer credit, i.e., credit card balances Such balances aren’t rising because incomes are rising, and consumers can afford higher credit balances. They are rising because of inflation as the consumer attempts to maintain their living standard. But more concerning is the rise in credit card delinquencies, a trend that inevitably leads to write-offs at banks and shadow banks.
Over the past few months, we’ve seen large negative numbers come out of the housing sector: Existing Home Sales are down at a -40% annual rate from its peak; Pending Home Sales -37%; Housing Starts: -40%; and Building Permits: -25%. The housing cycle decline so far in this cycle is much more severe than in any other Fed tightening cycle over the past 40+ years. And this Fed hasn’t finished raising rates!
Most American have the majority of their wealth tied up in the value of their home and often the equity in their home is used to make large purchases, appliances, vacations etc. We expect that this will have an impact on these future purchases
The supply chain issues are mainly behind us. Global shipping costs are now below their pre-Covid levels, and demand from the U.S. consumer is falling. We suspect that goods inflation will soon be 0% or even negative. The savings rate is now at a 17-year low, and all the free money from 2021 has been spent.
The Challenger Gray and Christmas layoff metric is up +416% Y/Y, the highest since January 2021, and hiring intentions are cratering. The point of all of this is that if you have a portfolio that is passively managed and full of index and ETF Funds chances are you will experience another volatile year. Don’t let your advisor tell you what to do tell them what to do. Manage your risk and expectations and remember sometimes sitting on cash for a little while can provide you with opportunities when they present themselves. In these types on environments that we need to go back to basics, stick to the fundamentals and buy wisely. Source Economist Bob Barone
A Technical Perspective
For those new readers to our newsletter technical analysis is an investment strategy /trading discipline that relies on identifying opportunities by analyzing statistical trends gathered from trading activity, such as price movement and volume. While no one can identify the bottom and peak price of a security, technical analysis tries to identify opportunities close to it.
Historically December is typically one of the better performing months of the year for the markets. However, this year, December has gotten off to a rocky start. The S&P 500 has had a continued pattern of lower highs and lower lows. Two weeks ago, the S&P 500 challenged its 200-day moving average of price, which can act as a key point of resistance. It had previously failed to break above the moving average back in August. Two weeks ago, it failed once again.
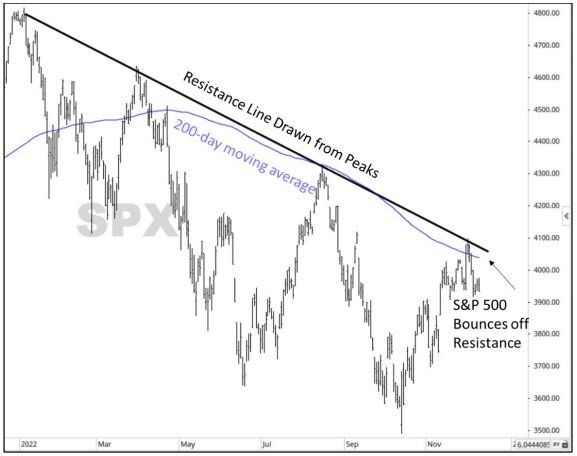
In the chart above for the S&P 500 this year, the blue line represents the S&P 500’s 200- day moving average (price). The downward sloping “trend” line marks price resistance of the index and has been drawn from the market’s recent peaks. Notice that each time that trend line is hit there is a bounce back, meaning the resistance is more significant. Notice that the trend line and the 200-day moving average have not crossed over. The S&P 500 index has rode alongside the line each time, prior to moving lower with each decline.
On the positive side, when the market reached the moving average and trend line, it was 86% short-term overbought, meaning that the likelihood of a pullback was rising. Now that the market has pulled back, the index is 92% oversold, increasing the likelihood of a rally. This is no guarantee that the market will rally, but the likelihood has a higher probability in the short-term.
We have seen some good performance recently in the International Markets. Up through mid-October. The U.S. Dollars has been one of the strongest performing asset classes recently. Typically, a rising US Dollar results in weaker relative performance for international equities. A strong US Dollar reduces the returns of a foreign security, whereas a weak Dollar increases the returns of a foreign security. Through most of 2022, the Dollar had experienced low volatility and rising value. But in recent weeks, volatility has expanded, and the Dollar has declined in value relative to other currencies
For Americans, and funds denominated in US Dollars, the performance of international securities is a function of both the percentage returns of those securities and the exchange rate of that country’s currency relative to the US Dollar. As the Dollar rises, the other currencies decline in value. However over the last few weeks, the dollar has declined, resulting in the other currencies rising. And international returns have been higher
Some international indexes have seen relative strength over the US markets recently. One benefactor of the falling Dollar has been the Euro Stoxx 50, an index made up of the 50 largest, most liquid eurozone stocks. This index has surpassed its 200 day moving average showing support not resistance.
As we enter the final weeks of 2022 historically the week between Christmas and New Year’s is usually one of the better performing weeks in a better performing month, because those that harvested tax losses, are generally looking to get back in for the start of the year. But we are still two weeks out. While the S&P 500 has wavered over the last few weeks, a weakening US Dollar has led to some strength in a few international indexes so money may flow in that direction.
While these international indexes look favorable, markets can always pivot. Much of this may be influenced by the results of the FOMC meeting on Wednesday and CPI numbers released tomorrow But for now at the time of this writing, the Euro Stoxx 50 index 4 is outperforming the US markets and is showing more favorable characteristics. Source Bandon Bischof
The Week Ahead
A massive week awaits ahead of the holiday season, focusing on inflation and central banks. It all kicks off with U.S. CPI on Tuesday, with November’s reading expected to edge down to 7.3% YoY from 7.7% in October. If the number is not lower, then the markets may get shaken up. The CPI is the final key piece of data before Wednesday’s FOMC meeting, and Fed Funds futures are currently pricing in a 77% probability of a 50bps hike, which is far from a certainty.
A disinflationary print could reinforce the idea that inflation has peaked and set the path towards a smaller rate increase in January. Elsewhere, the Bank of England is grappling with 6% wage growth and still rising inflation as it meets Thursday, where a 50bps hike is likely. The European Central Bank gathers on the same day, and contrary to President Lagarde’s recent comments there are signs of price increases slowing, which may prompt a downshift to only a 50bps raise.
If all that wasn’t enough, on Friday global flash PMIs will be released. Other U.S. events of note include retail sales, Treasury auctions, and the Philly Fed Manufacturing Index. Overseas, take note of UK GDP on Monday, EU economic sentiment on Tuesday, and China’s retail sales and industrial production figures late Wednesday.
This article is provided by Gene Witt of FourStar Wealth Advisors, LLC (“FourStar” or the “Firm”) for general informational purposes only. This information is not considered to be an offer to buy or sell any securities or investments. Investing involves the risk of loss and investors should be prepared to bear potential losses. Investments should only be made after thorough review with your investment advisor, considering all factors including personal goals, needs and risk tolerance. FourStar is a SEC registered investment adviser that maintains a principal place of business in the State of Illinois. The Firm may only transact business in those states in which it is notice filed or qualifies for a corresponding exemption from such requirements. For information about FourStar’s registration status and business operations, please consult the Firm’s Form ADV disclosure documents, the most recent versions of which are available on the SEC’s Investment Adviser Public Disclosure website at www.adviserinfo.sec.gov/
The Optimized Investor
