
Economic Slowdown, Healthcare issue & Other Economic News
for the
Week Ending August 20th 2021

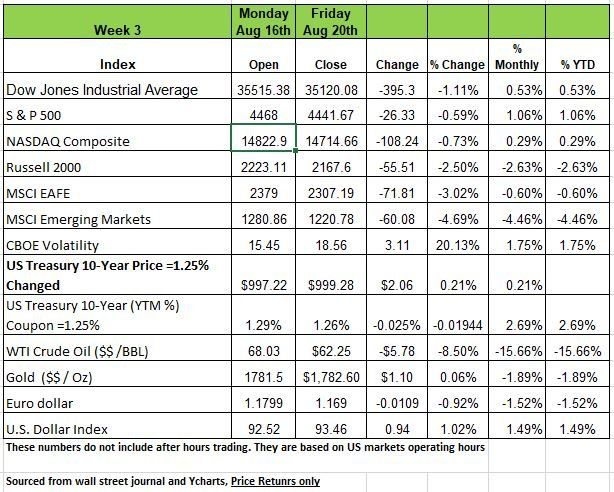
U.S. equities fell slightly on tapering and slowing growth concerns. The Dow was down -1.1%, S&P500, and Nasdaq Composite indexes slipped a little under 1% , while the Russell 2000 dropped 2.5% and tested some key support levels.
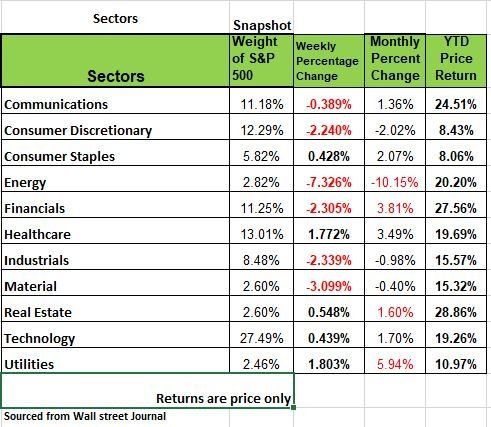
In the cyclical sectors 6 of the 11 sectors were in the red as several were hit hard such as basic materials sliding -3% and industrials slumped -2.3%, while energy stocks plunged- 7.3% as crude oil came under pressure on demand fears.
The DXY rose .94 as a strong U.S. dollar continued to punish most commodities and emerging market stocks.
The financial and consumer discretionary sectors also suffered as U.S. Treasury yields drifted lower and retail earnings failed to excite.
Defensive names from the utilities, healthcare, and consumer staples sectors rose. Minutes from the July Fed meeting revealed that most members support reducing monthly bond purchases before the end of the year while reaffirming that tapering is not linked to imminent rate hikes.
U.S. economic data mostly reflected recovery anxieties highlighted by a 1.1% drop in July retail sales. Manufacturing numbers disappointed as rising prices continued to weigh, with the Empire State Index falling to 18.3 in August, down from a record 43, and the Philly Fed Index sliding to 19.4 from 21.9.
Homebuilder sentiment for August dropped to the lowest reading since July 2020, while July housing starts fell more than expected as construction costs and high home prices continued to constrain activity.
Longer termed Treasury yields dropped last week as the August 18, the Federal Reserve Board and FOMC July 27-28 minutes were released. They discussed some economic progress in light of COVID and noted that several impacted sectors have improved but are not yet fully recovered. They commented again that “Inflation has risen, largely reflecting transitory factors.” The Board feels that financial conditions remain accommodative and intends to continue pursuing accommodative policy until inflation moderately above 2 percent has been experienced such that inflation averaged 2 percent over time.
It does insist that inflation “expectations remain well anchored at 2 percent.” It was with such considerations that it left key rates unchanged. Regarding asset purchases the Committee discussed that it currently purchases $80 billion/month of Treasury securities and $40 billion/month of agency mortgage-backed securities.
Since the December increase to the above rate, the Committee has observed that “the economy has made progress towards these goals (inflation and employment), and the Committee will continue to assess progress in coming meetings
Some The Data Points to consider
The big surprise of the week was the -1.1% M/M fall in July’s Retail Sales (-1.6% in “real” inflation adjusted terms). The overly optimistic consensus estimate was for a -0.3% decline. Excluding autos, sales fell -0.4% (consensus: +0.2%) and excluding autos and gasoline, -0.7% (consensus: -0.1%). Looking at this by selected sectors:
· Building Materials: -1.2% (negative four months in a row)
· Autos: -3.9% (negative three months in a row)
· Web-based Sales: -3.1% (negative two of the last three months)
· Clothing: -2.6%
· Groceries: -0.7%
Restaurants: +1.7% (unfortunately, Open Table has indicated a significant decline in restaurant reservations; -8% lower than pre-Covid the week of August 10, likely caused by the Delta-variant; reservations were higher than pre-Covid levels in June).
The control number from Retail Sales that feeds into GDP: March: +10.6%; May: -2.0%; July: -1.6%. How do we get to the consensus +7% GDP growth for Q3?
Housing: This looks to be well past its peak.
· The NAHB Homebuilding Index showed up at 75 in July vs. 80 in June. Five points is a huge decline for this index.
· As discussed last week the University of Michigan (U or M) Consumer Sentiment Index shows Home and Auto buying at 40-year lows and appliances at a 10-year low. The Home Buying Intentions Index: December: 134; February: 125; April: 114; June: 74; August: 61. 70% of those polled say now is a “bad” time to purchase a home – the worst number since August, 1982! (For auto buying plans, the survey registered the worst number since May, 1981!)
Housing starts were off -7.0% M/M (consensus: -2.6%). YTD starts are down -12.8% annual rate (AR), with single family starts down a whopping -25.1% AR. (Multifamily starts are up significantly; perhaps this will help moderate the oncoming upward pressure in rents!)
Nevertheless, the “consensus” views of where the economy is and where it is going all appear to be on the overly optimistic side. Perhaps these are all sell side economists just wanting to keep stock prices elevated. Citigroup has developed an “Economic Surprise” Index. When the consensus views are “less” than the incoming data release, that is a “positive” surprise. When the consensus is more optimistic than the income data, that is called a “negative” surprise. The overly optimistic views are shown in the chart – 14 straight days of negative readings. And the chart shows general negative readings for the last three months.
The commodity price cycle, a major contributor to the “systemic” inflation hysteria, appears to have run its course. The following data show percentage declines from recent peaks (prices are as of August 19):
· Lumber: -72.8% (13 month low)
· Iron Ore: -36.5% (8 month low)
· Oil (WTI): -15.4% (3 month low)(when will it transfer to the pump?)
· Copper: -15.3% (3 month low)
China and the Delta-Variant
China recently closed the world’s third busiest container port. This means more delays in the supply-chain and a continuation of cost and availability issues for many businesses. The chart shows the explosive cost to rent a shipping container because most of them are parked in the ocean waiting for an opening at a port.
Retail sales in China were slightly negative for July (-0.1%), very unusual for the fastest growing developed economy in the world. Even Industrial Production was off -1.3% and that has been negative in four of the last five months. The unemployment rate ticked up to 5.1% in July from 5.0%. The headline of the story on page A16 of the Wall Street Journal (8/17) read: “China’s Recovery Is Losing Steam.”
· The Delta-variant continues to pay havoc with the economic recovery in the U.S. and worldwide:
· Air travel in the U.S. has declined two weeks in a row.
· Hotel bookings are falling.
· Restaurant reservations are falling.
· Many companies have announced significant delays in their return-to-office schedules.
Source Bob Barone PhD Economist
U.S. Expansion Slowed in August
The U.S. economy is losing momentum. So much of the hype came off of the low baseline number from the shutdown but now reality is catching up with us. Demand is softening at a time of rising Covid-19 cases, the end of the Fed’s helicopter money, labor shortages and persistent knots in shipping networks which are straining businesses in the U.S. as well as across the globe.
The biggest shifts are occurring in the U.S., which is the real driving force in the global economic health. U.S. factories and service providers reported sharply slower growth this month, as reported by the forecasting firm IHS Markit in its surveys of purchasing managers. Its index of service-sector activity, the broadest segment of the economy, fell to 55.2 in August from 59.9 in July, hitting an eight-month low. An index of factory activity dropped to 61.2, a four-month low, from 63.4 in July. A reading above 50 suggests growth activity (as measured by sales, output, prices and other factors). Recent cancellations or postponements of activities in various industries, including concerts and colleges, are likely to hinder consumer spending and economic growth. Country singer Garth Brooks became the latest big-ticket artist to cancel shows. Rice University in Houston moved the first two weeks of the coming semester online. With 10 days left in the month we will get more information on the direction we are heading. Source https://www.wsj.com/articles/u-s-expansion-slowed-in-august-survey-shows-11629733159?mod=hp_lead_pos4
Labor Markets
Initial Claims (ICs): Initial Unemployment Claims, a proxy for new layoffs, moved down -12K in the state programs to 309K during the week of August 14. However they rose +5K in the federal Pandemic Unemployment Assistance (PUA) programs. Only a small decline (-7K) on net about offsetting last week’s small rise. PUA is assistance for 1099 employees so this probably includes a lot of fraud.
The PUA IC programs, which have been running just north of 100K/week, end on September 4. State programs will be all that is left for new claimants. The state programs, at about 309K/week are not that far above their pre-pandemic norm of 200K. We expect that, by September’s end, we will see the state numbers re-approach this pre-pandemic norm, albeit the re-emergence of the virus may keep some parents from rejoining the labor market due to child-care and school issues.
Continuing Claims (CCs): Continuing Unemployment Claimants from all programs continue to fall. They were 12.1 million the week of July 24 and fell to 11.7 million the week of July 31 (latest data). As indicated in past blogs, the vast majority of these claimants are in the PUA programs which end September 4. Unless Congress extends these programs (haven’t heard such talk yet), nearly 9 million will be without a weekly check. Will this be an impact on Retail? not if its all from fraud.
We have been following the state CC data for several months from the point of view of Opt-In states vs. Opt-Out (those states in or out of the federal $300/week supplemental unemployment benefit program). the data appears to be conclusive that the federal supplement has dis-incented the desire or need to work. However will admit this is full of deception and once tax returns are completed we probably wont see how many people doubled dipped.
Hospitals and Insurers Didn’t Want You to See These Prices. Here’s Why.
There are a number of different opinions about Healthcare in the U.S. Many of those focus on the cost of Health insurance. The ACA (Affordable Care Act) which was passed during the Obama Administration did not achieve its objective and quite frankly went about the process all wrong. In 11 years, the price of Health Insurance has risen more than 400%. The inflation rate of healthcare is far higher than all other sectors of our economy.
For some reason we place the burden of Healthcare on Insurance companies. It’s a fragmented industry that encompasses too many players to mention, but Healthcare is just one component. Why no one argued on the constitutionality of the government forcing a business with someone they had no interest in doing business with is still puzzling. Since the ACA we have seen a lot of consolidation on the hospital and physician practice side of the industry. This gave medical facilities a little more muscle to negotiate reimbursement with insurance carriers.
In a recent article in the N. Y. Times found that the price of a procedure varied significantly from one carrier to the next. This year, the federal government ordered hospitals to begin publishing its prized secret: a complete list of the prices they negotiate with private insurers. This was a law passed during the Trump Administration. But The insurers’ trade association had called the rule unconstitutional and said it would “undermine competitive negotiations.” Four hospital associations jointly sued the government to block it, and appealed when they lost and lost the appeal. Many Medical system refuse to comply with the law
Here is just one example of the problem in order to have a procedure performed a patient needs a diagnosis code. Each diagnosis code has a number of procedure codes that can be used to treat such a diagnosis. Medical facilities are interested like any other business to maximize the amount of money they can charge for a procedure. When a facility enters into a contract with a carrier, they are obligated to the negotiated price with members of that insurance carrier. But members of that carrier only look to make sure the facility is in network.
Insurance is all based on the law of large numbers meaning that with all the data the health insurance carriers have they know exactly where to negotiate. Most people have higher deductible plans since the ACA was passed in order to save premium dollars, so a lot of out patient procedures are usually applied to the deductible so when you see the cost of an MRI or Colonoscopy vary significantly as the NY Times article address is because they carriers know it will be passed along to the member.
Federal regulations limit insurers’ profits to a percentage of the amount they spend on care. It’s the only industry limited to profit by the Federal Government which is 15% of total premiums collected. In some plans involving large employers that are self-insured, Carriers are not even using their own money. The employers pay the medical bills, and give insurers a cut of the costs in exchange for administering the plan. Source https://www.nytimes.com/interactive/2021/08/22/upshot/hospital-prices.html?referringSource=articleShare
The Consumer Discretionary sector
Part 2 of out sector analysis is in the Consumer Discretionary sector which includes internet retailers, automobiles & parts, household durable goods (e.g., refrigerators, washers/dryers), consumer durable goods (e.g., televisions, home audio equipment), leisure products (e.g., sports equipment, bicycles, toys), apparel, luxury goods, footwear, casinos, hotels, fitness centers, restaurants and bars.
The Consumer Discretionary sector—which is typically sensitive to swings in the economy—had its winners and losers with the onset of the COVID-19 pandemic. The massive stimulus efforts and stay-at-home orders spurred a surge in spending on home improvement and e-commerce sales early in the crisis—and the related stocks led the equity market rally.
Now, with the ongoing vaccine distribution, even the most beaten-up stocks in the sector—like those in the apparel and hotel industries—have recovered & in many cases extended well beyond pre-crisis price levels.
The cruise industry is the exception. But these industries are often overshadowed by bigger companies in the sector—like Amazon and Tesla—that constitute more than 40% of the sector’s market cap. The longer-term trend toward e-commerce & electric vehicles is likely to continue to support the fundamentals of these growth industries, but investor enthusiasm may have pushed valuations to its limit.
Although higher interest rates are in part reflecting stronger economic expectations, they can weigh on an investors’ perceived value of future earnings. Additionally, a severe semiconductor shortage is becoming a significant risk to the production of many consumer electronics & vehicles.
Positives for the sector:
Vaccine distribution and ongoing economic recovery are positive for many of the more traditional discretionary industries.
The shift away from brick-and-mortar is likely to continue to support the fundamentals for online retailers.
Pro-cyclical macroeconomic tailwinds when the economy is strong—though the sector hasn’t traditionally been a strong performer in the expansion phase of the business cycle.
Negatives for the sector:
The sector is overly concentrated in internet retail and automobiles.
Valuations and investor enthusiasm appear stretched; higher interest rates can weigh on both.
Semiconductor shortages weighing on auto and consumer electronics production. But the biggest negative is that the Fed Stimulus and unemployment support has driven this sector now that this is coming to an end, we expect a slide
Risks for the sector:
Antitrust action is possible for the largest online retailer. Fed Helicopter money running out!!
The Week Ahead
On Friday stocks rallied, paring back some of the week’s losses, after Dallas Fed President Kaplan said he may change his mind on the Fed starting to taper bond purchases soon if the coronavirus delta variant is slowing the economy. This shows what a tight spot the Fed is in, with diverse opinions and outlooks that may change from meeting to meeting. This week Chair Powell will deliver an economic outlook at the annual Jackson Hole Symposium which starts on Thursday, and market participants will be watching for the latest insights into the Fed’s timetable. Today kicks off with slight downticks expected in manufacturing and services PMIs from the U.S. and Germany. U.S. existing and new homes sales also drop early this week, followed by durable goods on Wednesday and the second look at Q2 GDP on Thursday. The international calendar includes the German ifo Business Climate report, minutes from the most recent ECB meeting, and Australia’s retail sales. The week closes with an update on U.S. inflation in the Core PCE Price Index, and revised UoM Consumer Sentiment numbers
Major economic reports (related consensus forecasts, prior data) for the upcoming week include Monday: August Preliminary Markit US Manufacturing PMI (62.5, 63.4) and July Existing Home Sales (5.83M, 5.86M); Tuesday: July New Home Sales (697K, 676K); Wednesday: August 20 MBA Mortgage Application (N/A, -3.9%), July preliminary Durable Goods Orders (-0.3%, 0.9%); Thursday: August 21 Initial Jobless Claims (350K, 348K) and 2Q GDP Annualized QoQ (6.6%, 6.5%); Friday: July preliminary Wholesale Inventories MoM (1.0%, 1.1%), July Personal Income (0.2%, 0.1%), July Personal Spending (0.4%, 1.0%) and August final University of Michigan Sentiment (70.5, 70.2).
This article is provided by Gene Witt of FourStar Wealth Advisors, LLC (“FourStar” or the “Firm”) for general informational purposes only. This information is not considered to be an offer to buy or sell any securities or investments. Investing involves the risk of loss and investors should be prepared to bear potential losses. Investments should only be made after thorough review with your investment advisor, considering all factors including personal goals, needs and risk tolerance. FourStar is a SEC registered investment adviser that maintains a principal place of business in the State of Illinois. The Firm may only transact business in those states in which it is notice filed or qualifies for a corresponding exemption from such requirements. For information about FourStar’s registration status and business operations, please consult the Firm’s Form ADV disclosure documents, the most recent versions of which are available on the SEC’s Investment Adviser Public Disclosure website at www.adviserinfo.sec.gov/
The Optimized Investor