
Economic Landscape and
Weekly Market Review for August 1, 2023

The content of this Newsletter is to provide you with Economic insights to assist you in making better decisions with your investments. Unlike many other financial periodicals we will not mention specific companies, unless it is relevant to an overall economic issue. We welcome your questions on economic concerns and will address in our newsletter. just email us at info@optfinancialstrategies.com #FinancialAdvisor,#investmentmanagement #wealthmanagement #financialplanning #retirementplanning #401kplans
Week In Review
All indices posted positive returns on the week with the NASDAQ returning +2.02% followed by the Russell 2000 +1.09% the S&P +1.02% and the DOW +0.66%. All of the indices are up for the month of July and the start of Q3. All this movement comes on more positive earnings from the majority of companies reporting better than expected numbers. Last week’s movement still came on another Fed interest rate hike and hawkish tone that left investors realizing that another rate hike was possible. Fed Chair Jerome Powell stated they will be monitoring employment reports, CPI reports and employment cost reports to determine whether the Fed will continue to raise rates in September.
The markets seemed to deflect this information as equities continued their push higher as hopes have grown that the economy will avoid a recession and the Federal Reserve will be able to achieve a soft landing after raising rates to combat inflation.
The largest gain last week came on Friday as reports showed consumer spending increased more than expected and the core personal consumption expenditures year-over-year price index came in lower than expected and lower than the previous month. In addition to the continued decline from inflation’s peak of 9.1% in June 2022 to its current 3.0%, economic strength has appeared resilient in this tight labor market as unemployment and jobless claims remain low. U.S. initial jobless claims were reported at 221K last week, lower than the previous week’s 228K and the consensus estimate of 235K.
Treasury yields were higher throughout the week with longer duration seeing the largest increases. On Tuesday, new home sales declined 2.5% in June following three consecutive months of gains. Despite the decline, sales are 28.4% above the low in July of last year.
On Thursday, new orders for durable goods rose 4.7% in June, easily beating consensus expectations of 1.3%. The increase in orders was led by commercial aircraft, which surged 69.4% in June.
Real GDP grew at a 2.4% annual rate in Q2, beating consensus expectations. The growth in Q2 was led by consumer spending and business fixed investment. On Friday, personal income rose +0.3% in June but fell short of consensus expectations of +0.5%. Gains were led by private-sector wages and salaries (+0.6% for the month and up 5.9% year-to-year). Today transportation company Yellow filed for bankruptcy, evidence that transportation of goods has been reduced significantly.
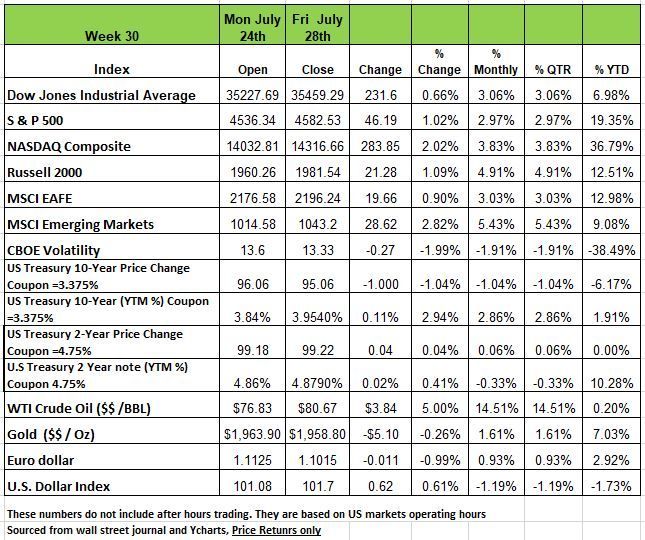
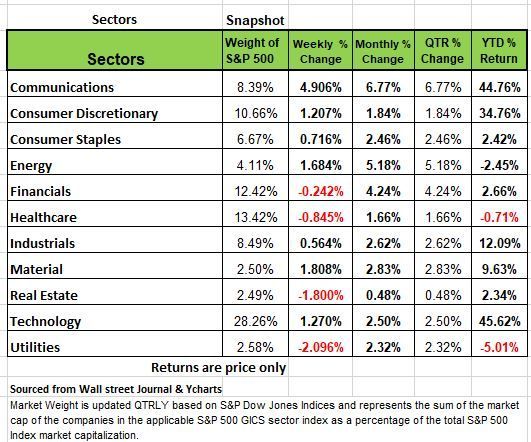
The S & P 500 index rose 1.0% this week, led by the communication services sector, amid stronger-than-expected Q2 earnings while US economic growth for Q2 also surpassed expectations.
Communication services had the sharpest weekly increase, up +4.9%, followed by a +1.8% increase in materials and a +1.7% rise in energy. Other sectors that gained included technology +1.27%, consumer discretionary +1.2%, consumer staples +.71% and industrials +.54%.
The Four sectors that posted weekly declines were: Utilities shed -2.1%, real estate lost -1.8%, health care dropped -0.8% and financials edged down -0.2%.
The gainers in communication services were led by Facebook parent Meta Platforms (META) and Google parent Alphabet (GOOGL), which jumped 11% each. Meta Platforms posted Q2 results that exceeded Wall Street's estimates and released stronger-than-expected revenue guidance for the current quarter. Alphabet delivered Q2 per-share earnings and revenue that topped year-earlier results and market estimates as revenue growth accelerated in its search and YouTube businesses.
In the materials sector, International Paper (IP) gained 12% as the packaging and pulp company reported Q2 adjusted operating earnings per share above analysts' mean estimate despite net sales coming in slightly below consensus.
In the energy sector, shares of Hess Corp. (HES) added 4.8%. The oil and gas company posted Q2 adjusted net income per share above analysts' mean estimate and raised its guidance for 2023 net production, citing strong operations performance and the expected startup of its Payara development in early Q4.
Decliners in the utilities sector included shares of Xcel Energy (XEL), which shed 3.6% on the week. The electricity company reported Q2 earnings per share as well as revenue below year-earlier results and analyst estimates.
In the real estate sector, shares of UDR (UDR) declined 7% as the multifamily real estate investment trust reported Q2 adjusted funds from operations and revenue below analyst estimates.
This week's earnings calendar features Merck (MRK), Pfizer (PFE), Advanced Micro Devices (AMD), Caterpillar (CAT), Starbucks (SBUX), Apple (AAPL), Amazon.com (AMZN), ConocoPhillips (COP), and Berkshire Hathaway (BRK.A, BRK.B).
Among economic reports, the Labor Department's July employment data are likely to receive the most attention. Other reports expected next week include the Institute for Supply Management's latest readings on the manufacturing and services sectors.
The Fed raises rates.
All eyes were on Jerome Powell during his press conference on Wednesday, while most investors expected a 25 bps rate increase taking the Fed rates between 5.25% to 5.5% range, this was the 11th increase since early 2022. More investors were looking for the FMOC’s position on future rate hikes. Much of the industry was betting on this being the last increase but Powell was clear that we had a long way to go to tame inflation, especially core inflation. The next FMOC meeting will be in Sept and the odds of another increase have increased slightly. While there is no FMOC meeting in August there is a summit toward the end of August in Jackson Hole WY, where the Fed will address more global economic issues.
Many financial professionals think a recession is coming because the economy was artificially stimulated during COVID. Even though M2 money supply has declined in the past year, there are still issues to address. With short-term interest rates at all-time highs over the last decade, there is a decent reward now for short-term cash instruments, so while the yield curve remains inverted it will most probably limit business investment and risk-taking in general.
Many also believe that mortgage rates (along with credit card and auto loan rates) are so high now that those taking out credit at current higher rates will be squeezed enough to cause spending to fall in other areas, leading to a slowdown in the economy. But this has not happened yet and is a surprise to many economists.
The theory has some merit. If we look back in 2021 the median existing home sold for about $350,000 while the typical 30-year fixed mortgage rate was near 3.00%. If a buyer put 20% down, the principal and interest payment would be $1,180 per month. Now the median existing home sells for about $400,000 while the typical mortgage rate is about 6.8%. As a result, a purchaser putting 20% down faces a monthly payment of $2,086. That’s an increase of 77% or extra mortgage payments of $10,872 per year, which is a heavy lift for most households. So, this is why some analysts and investors are concerned. But not everyone is buying homes and the demand varies by region as we can see by the number of new homes being built in areas like Texas and Florida.
In addition, Real GDP grew at 2.4% in Q2, and that led the majority of forecasters to join the “soft-landing” camp. As chronicled by Rosenberg Research, real GDP averages a 2%+ annual rate in the quarter in which the Recession begins, and that includes the Great Financial Crisis (in Q4 2007 GDP grew at +2.2% annual rate). In addition, and of great significance, it is widely known that monetary policy impacts the economy with a long and variable lag; most economists put this lag at 12 to 15 months. Yet despite the fact that much of this past year’s interest rate increases have yet to be felt, the Fed raised rates another 25 basis points (.25 pct. points) at last week’s meeting (July 26).
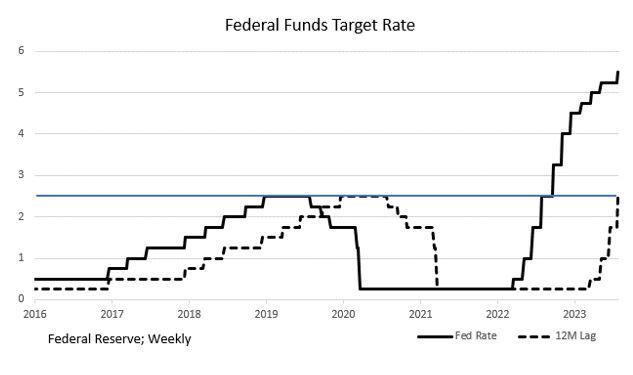
The chart above may make it easier interpret things.
The Fed has states that the “neutral” Fed Funds interest rate, i.e., the rate that is neither “loose” nor “tight” and has no economic impact, is 2.50%. The blue line in the chart shows “neutral.” Rates above are restrictive, below are accommodative.
The solid black line is the actual path of the Fed Funds rate since 2016.
The dashed line shows the path of that Fed Funds rate with a 12-month lag.
The implication here is that, if monetary policy acts with a 12-month lag, then the dashed line represents monetary policy’s economic impact. In looking at the right-hand side of the chart, one can see that, until now, the effective (12 month lagged) rate has been below the 2.50% neutral rate since the hiking cycle began in March ’22. The Fed didn’t raise its Fed Funds rate above the 2.50% “neutral” rate until late September 2022. As a result, if the 12-month lag is accurate, then monetary policy has effectively remained accommodative and won’t turn restrictive until this upcoming September. Hence, the Q2 positive GDP growth shouldn’t come as a surprise. However, a look at the chart shows rapid and accelerating restriction beginning in Q4. Since there are already cracks appearing in the economy, the implication is that the economic landing may not be so soft.
While many may argue that GDP came in better than expected 2.4% annualized for Q2, when we look a little deeper into that number, we find that the rise in GDP occurred for reasons other than what one would normally expect. Consumer spending only rose 1.6% in Q2 (vs. 4.2% in Q1). Food Services and Accommodation (restaurants and hotels) fell -2.9%, the worst reading since the opening days of the pandemic. Durable goods purchases were flat (0% growth). GDP growth was led by transportation services, i.e., the airlines (+9.8%) as demand for non-driving vacations was exercised by many. So, the rise in transportation services appears that it may be a one-time event.
There was one area of strength and that was seen in non-residential construction or industrial facilities (+9.7%). With the international political climate in China being so uncertain we have seen an onshoring of tech related production facilities, especially chip related. Such facilities are quite expensive to build. In addition, state and local governments increased their spending at a 3.6% annual rate in Q2, after a 4.4% rise in Q1. So, while this spending will mean more construction work the rise in GDP was not from a lot of consumer spending which typically drives the economy. Source Economist Bob Barone Ph.D.
A Technical Perspective
For those new readers to our newsletter technical analysis is an investment strategy /trading discipline that relies on identifying opportunities by analyzing statistical trends gathered from trading activity, such as price movement and volume. While no one can identify the bottom and peak price of a security, technical analysis tries to identify opportunities close to it.
For the first six months of the year, the markets were driven by technology-related stocks. The securities that were hit the hardest in 2022, such as Meta, Nvidia, and Tesla, saw substantial (parabolic) rises in the first half of 2023 and carried the S&P 500 higher due to those stock’s large weightings within the market index.
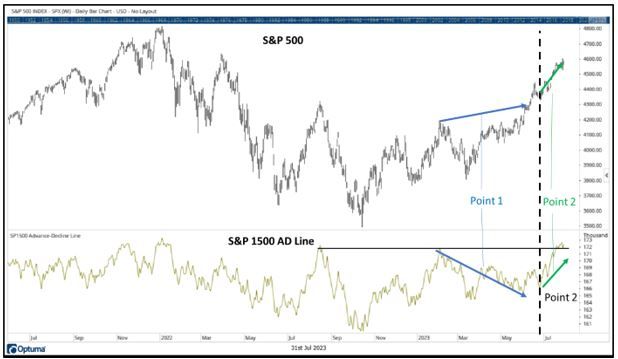
As a matter of fact, outside of technology stocks, markets had looked rather weak prior to July. For the last month, however, breadth in the markets has been steadily improving. Take a look at the chart below, which shows the S&P 500 along with the Advance Decline Line for the S&P 1500 stocks. The AD line measures the number of advancing stocks versus declining stocks. You can see that at point 1, even as the market had gone higher, the AD Line was falling, meaning a few larger stocks were leading the market higher while most stocks fell off. Now, at point 2, the AD Line is beginning to rise and put in a new relative high. More stocks are participating.
Outlier Days
We have now gone 57 trading days without an outlier day (a trading day beyond +/-1.50%). This is the longest streak without an outlier day since a 74-day streak that ended in January of 2020. A lack of outlier days is a sign that the market is trading efficiently, but also that volatility is getting “squeezed” down like a spring. Eventually, the market may relieve some pressure in the form of an outlier day.
Historically (going back to 1950), there have been almost the same number outlier days to the upside (a trading day beyond +1.50%) as there have been to the downside (a trading day less than -1.50%). The current streak of trading days without an outlier is the 14th longest streak since the year 2000. We bring this up because long streaks without an outlier day have tended to end with an outlier day to the downside. Of the twenty longest streaks without an outlier day since 2000, all but two of those ended with an outlier day to the downside. It should be noted, however, that many of these markets returned to normal behavior following the outlier, meaning that the market relieved that pressure and continued along.
It is a positive sign that market breadth is improving. It shows that more than just technology stocks are participating in upward movements. It should be cautioned, however, that technology-related stocks do make up a majority of the S&P 500 index weightings. Many of those stocks are beginning to report earnings. Meta reported earnings last week that were viewed as favorable. As a result, the stock “popped” to the upside. This is just daily noise. Other technology companies will be reporting earnings this week. If those earnings come back as unfavorable, you may expect to see those stocks experience some noise to the downside, and thus drag the market, regardless of how other stocks are doing.
An outlier day, even to the downside, it not an event to be fearful of. If an outlier day occurs, it will be important to monitor how the markets react in the days following the outlier—whether volatility climbs or returns to normal. Source Brandon Bischoff
The Week Ahead
Another busy week awaits as the calendar turns to August, highlighted by U.S.jobs data and corporate earnings along with rate decisions for the UK and Australia. With the FOMC on hold until September, economic data will influence whether the U.S. has seen a peak in interest rates. The backdrop of ebbing inflation and strong growth has fueled stock prices thus far, but policymakers are wary of a reacceleration of price pressures.
The U.S. employment picture is expected to continue to trend towards moderate growth, and average hourly earnings will be closely watched in Friday’s government report. The private sector ADP and JOLTS job openings reports will land on Tuesday and Wednesday. ISMPM Is will also be released, and although services have led the U.S. economy for months, investors would like to see less severe contraction in manufacturing to support bullish sentiment.
Earnings season is wrapping up with big reports on tap from Apple, Amazon, Qualcomm, and Advanced Micro Devices. Preliminary Q2 non-farm productivity and factory orders complete the domestic agenda.
Overseas, the Bank of England has seen inflation slow, but wage growth persists, meaning a likely 25bps hike on Thursday and more later this year. Economists are split on whether Australia’s Reserve Bank will hike or hold with consumer inflation and PMIs fading. Europe’s flash CPI estimate will be released today along with Q2 GDP, which may influence future rate hike expectations. Finally, China’s private sector and Caix in PMIs will filter in throughout the week.
This article is provided by Gene Witt of FourStar Wealth Advisors, LLC (“FourStar” or the “Firm”) for general informational purposes only. This information is not considered to be an offer to buy or sell any securities or investments. Investing involves the risk of loss and investors should be prepared to bear potential losses. Investments should only be made after thorough review with your investment advisor, considering all factors including personal goals, needs and risk tolerance. FourStar is a SEC registered investment adviser that maintains a principal place of business in the State of Illinois. The Firm may only transact business in those states in which it is notice filed or qualifies for a corresponding exemption from such requirements. For information about FourStar’s registration status and business operations, please consult the Firm’s Form ADV disclosure documents, the most recent versions of which are available on the SEC’s Investment Adviser Public Disclosure website at www.adviserinfo.sec.gov/
The Optimized Investor
