
Economic & Market News for the Week Ending
April 14th 2022

The content of this Newsletter is to provide you with Economic insights to assist you in making better decisions with your investments. Unlike many other financial periodicals we will not mention specific companies, unless it is relevant to an overall economic issue. We welcome your questions on economic concerns and will address in our newsletter. just email us at info@optfinancialstrategies.com
Last week was a short week of trading as markets were close Friday in observance of the Good Friday holiday. One of the 4 major indices were in the black last week with the Russell 2000 having a modest return of .52% while the other 3 indices were down. The S&P and the Nasdaq were both down more than 2% for the week. By sector 4 of the 11 sectors were in the black with Energy and consumer staples leading the way both with more than +4% price returns. The sectors that seem to be showing the most resilience in this period of volatility are the more defensive sectors, Consumer Staples, Healthcare, Utilities and Materials. The 5 largest sectors of the S&P 500 Communications, Consumer Discretionary, Financials Industrials and Info Technology make up 62% of the Index, while the more defensive sectors make up the other 32%. So, it may be a good time to evaluate and rotate your portfolio to adjust for the risk associated with Index funds.
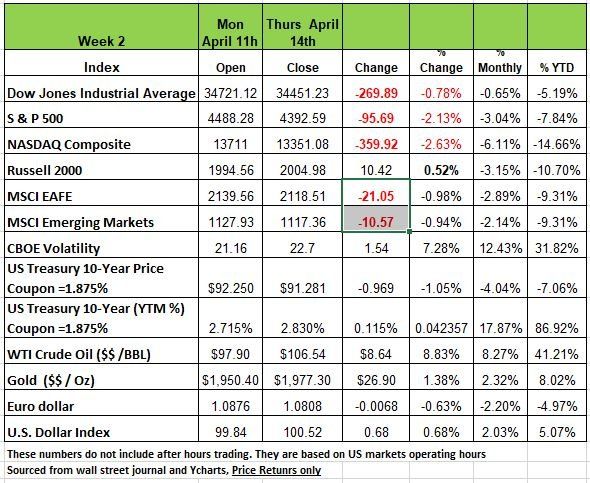
The big news last week was again centered around Inflation, coming in at 8.5% year over year which is causing the markets to anticipate a strong Federal Reserve response that has left bond prices lower as required yield has gone up. Unemployment remains very low, but that is mostly due to the size of the workforce which has not recovered from the pandemic. Many families have decided to keep one parent at home and those that have retired early have left the jobs market with over 5 million unfulfilled. This high reading, and low unemployment, may leave the Federal Reserve with an incentive to raise rates and reduce the money supply faster than expected at the beginning of the year.
As it stands, the Federal Funds Rate is still at 0.50 as the Federal Reserve was concerned at the last meeting over the conditions surrounding Ukraine. The market does not expect this caution to last. and Yields have been rapidly rising since the last meeting. The 10-year has moved from 2.144 to 2.827 and the 30 year has seen its yield rise from 2.478 to 2.915. Coming off record low yields, bond price sensitivity to change in yield is reflected in price performance.
For the US Treasury Note/Bond due 02/15/32, total return from March 15 through April 14 of this year was -5.71%. For the same period, the S&P 500 Index returned 3.16%; perhaps as investors shun yields which are well below the observed rate of inflation. Last week saw the interest rates on the popular 30-year fixed rate mortgage surpass 5.0%. This is the highest rate the 30 years has sported since 2011. 4% was only just recently pierced, in mid-March.

Labor Market Overview
The March employment report showed semi positive health of the U.S. economy as it continues to recover in the aftermath of the pandemic. The labor force is exhibiting signs of tightness. With an unemployment rate of 3.6%, (one of the lowest experienced in the last 50 years) an average monthly job gains of 600,000 over the last six months, you would think that all was great. However, the Labor Department reported that there were 11.3 million job openings at the end of February meaning there is a surplus of 5.3 million jobs over the number of unemployed workers.
This has led to a disequilibrium in the labor market which is due to changes in both sides of the supply-demand equation. Labor force participation has declined from 63.0% in March 2019 to 62.4% in March 2022, resulting in 1.6 million fewer workers in the labor force. This number includes early retirement and a parent that left the labor force during the pandemic to care for children home from school. How permanent this is will be seen later in the year most probably when the fall school session begins. In addition, lower immigration has all contributed to the supply side challenge.
However, even if we added back the 1.6 million “missing” workers into the labor force, the U.S. economy would still face a shortage of roughly 3.7 million workers relative to job openings.
What explains this huge excess in labor demand?
It’s a combination of job openings and employment at a sector level, if we measure “aggregate labor demand” from where the demand for workers is filled (current employment) and unfilled (job openings). In general, labor demand is greater by 3.5 million workers than it was pre-pandemic.
On a sector level, we can observe a few key changes:
The health care and social assistance sector has greater demand for labor despite experiencing minimal losses in employment, reflecting an increased need for health workers during and following the pandemic, in addition to the healthcare needs of an aging population.
Even if the leisure and hospitality sector filled all of their current job openings, it would still not cover the substantial loss in employment experienced during the pandemic as many workers took the opportunity (while out of work) to learn a skill or receive some education which allowed them to better qualify for higher-paying or better-quality jobs. In addition, this sector relies on immigrants and may not recover for a while.
The top sectors for aggregate labor demand are retail trade, transportation and warehousing, and professional technical jobs (a subset of professional and business services); they have also seen meaningful increases in employment. This was driven by strong goods demand throughout the pandemic and an increased need for cost-saving technology in the face of supply-chain issues.
While real GDP is 3.2% higher than it was in the fourth quarter of 2019. The growth seen last year was due to lower base numbers in 2020 during the shutdown as well as the infusion of money into consumer pockets. With this behind us, it may be difficult for GDP numbers to reach meet expectations. Maybe it is an indication that pandemic-related disruptions to the labor force may have become more permanent than initially thought and production output will suffer.
It seems for now that the remedy to this labor market disequilibrium will likely take time to resolve. Perhaps many jobs will move to more automation, find a way to develop better skills-based training for workers and increased immigration. In the meantime, investors should prepare for challenged corporate earnings moving forward.
Technical Analysis
If 2022 has proven anything, it’s that volatility comes in waves. To put it into perspective, 2022 has already surpassed 2021 in the number of “outlier” days experienced. We define an “outlier” day as a trading day of more than +/-1.50%. During calendar year 2021, the S&P 500 had 18 outlier days, with 8 of these days occurring in the first six months of the year and 10 happening in the last six months.
In the first quarter of 2022, the S&P 500 has experienced 21 outlier days. On average, that is almost one outlier day for every three trading days. If this is an indication of what the rest of the year is going to be like you may want to protect your portfolio and minimize risk by evaluating the weight of your risk.
The outlier days this year has been seen in several substantial moves in the markets, both up and down. Investors delt with two -8% drops that each occurred in under three weeks and separated by eight days, followed by a reversal of an 11% rise. Make no mistake about it, an 11% rise over 15 days is just as bearish as an 8% drop. Remember in volatile markets, volatility works in both directions.
The volatility in markets has applied not only to the daily movements and larger movements over a few weeks but also to intraday fluctuations. For example, there was a day in late January when the S&P 500 was down as much as -4% during the day before finishing the day UP 0.28%. The median intraday move in 2022 has been a swing of 1.77% (the difference between the greater of the daily high or prior day’s close and the daily low). That would be the equivalent of a day starting up about +0.9% and finishing down -0.9%.
In 2021, the median intraday fluctuation was half of that, at an intraday fluctuation of 0.86%. For perspective, there has only been ONE trading day in 2022 less than 0.86% intraday fluctuation, and that day was the first trading day of the year.
According to a popular TV journalist and self-proclaimed investment guru “there’s always a bull market somewhere.” While the general markets have fluctuated greatly, the vast fluctuation has mostly come from “growth” oriented stocks and sectors.
In looking at the S&P 500 Value Index (using ETF: SPYV) it is down about -1.00% year-to-date. S&P 500 Growth (ETF: SPYG), on the other hand, is down close to -15% year-to-date (as of the writing of the article) . That disparity should be telling you how investors feel. As mentioned at the top of this newsletter the leading 6 sectors performance wise this year account for 32% of the S&P while the other 68% is driven by the growth sectors which are lagging.
While we understand that the market’s volatility has been created mostly by growth stocks. There is even more volatility in the Bond market. This environment of rising interest rates makes bond price drop in order to achieve yield. Portfolios that have a 60 40 (fixed income and equity products) allocation are struggling with declining account balances. The markets are showing concern for the Fed’s ability to land a tightening monetary policy and rising interest rate environment without staling the economy.
The shift from growth to value positions has created opportunity engaged investors, particularly for investors with an adaptive portfolio strategy. Most traditional portfolios are in turnkey models with holdings that lean towards growth-oriented stocks, just by nature of holding market index & ETF funds and adhering to the philosophy of not being able to beat the market benchmark (S&P 500). However, a more adaptive portfolio can rotate away from volatility, and into more stable, lower volatile sectors.
The Week Ahead
Earnings season is here and accelerates, with Q1 reports due from companies in several key industry groups, including banks, trucking, airlines, metals, and technology.
On the economic calendar, the week begins with China’s GDP and retail sales numbers. China’s growth is forecast to slow to 5.0% in 2022, but likely grew 4.2% YoY in Q1 versus 4% in Q4. However, we can’t put any reliability on that information as the integrity of the numbers always seem to be in question and we know that the China Real Estate Markets is in serious condition.
The U.S. docket is sparse, but with mortgage rates surpassing 5% for the first time in over a decade, housing starts and existing home sales data will be closely scrutinized. On Thursday, the Philly Fed Manufacturing Index emerges followed by flash PMIs on Friday. Overseas, Germany’s PPI arrives Wednesday, expected to double from the prior month. The Eurozone’s final CPI reading is expected to confirm a 7.5% inflation rate, pressuring the ECB to outline an interest rate hike plan. The week wraps up with flash PMIs from Australia, Germany, and the UK, along with Britain’s March retail sales.
This article is provided by Gene Witt of FourStar Wealth Advisors, LLC (“FourStar” or the “Firm”) for general informational purposes only. This information is not considered to be an offer to buy or sell any securities or investments. Investing involves the risk of loss and investors should be prepared to bear potential losses. Investments should only be made after thorough review with your investment advisor, considering all factors including personal goals, needs and risk tolerance. FourStar is a SEC registered investment adviser that maintains a principal place of business in the State of Illinois. The Firm may only transact business in those states in which it is notice filed or qualifies for a corresponding exemption from such requirements. For information about FourStar’s registration status and business operations, please consult the Firm’s Form ADV disclosure documents, the most recent versions of which are available on the SEC’s Investment Adviser Public Disclosure website at www.adviserinfo.sec.gov/
The Optimized Investor
