
Dot-Plot What? 2nd Half & Other Economic News for the
Week Ending June 18th 2021

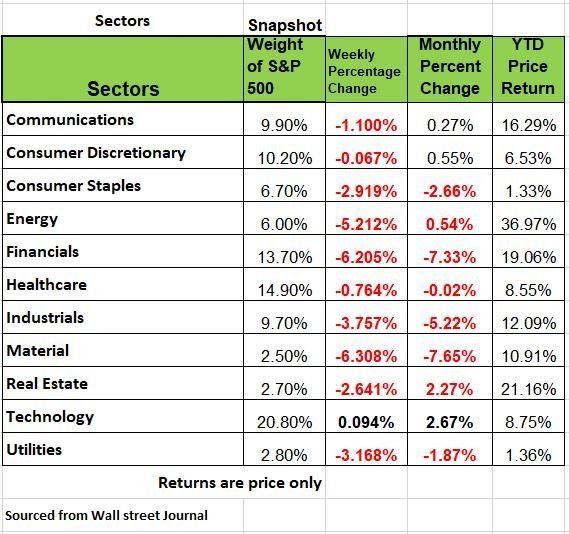
If you have read any newspapers or listen to anyone in the financial media since Friday you probably heard something to the effect that markets more than 3%. If you are like most people perhaps you focus on the negative. But if you look at the chart below, take notice that YTD all of the major indices are in positive territory. Its not a time to panic. The VIX a measure of volatility of options and future indicator is negative for the year. Meaning that we have been on a steady rise in prices

This is where other info goes New Paragraph
Dot-Plot What??
What caused the sudden sell off last week?
Fed Chair Jerome Powell released the Feds post meeting updates on the nation’s economy on the 16th. The release of the Feds “dot-plot” table, caused much of the panic. What is a Dot-Plot graph? The table originated in 2012 under Bernanke, it represents the 18 individual policy committee members views as to what the Fed Funds Rate level will be on December 31 of the next three years and then a longer-run view. But these charts are not the Fed’s view, but the view of each of the individual 18 committee members. All of whome have their own opinion on where they think rates will be. Again, this is not the Feds view. How accurate has this tool been in past? According to Rosenberg research the “Dot-plot” has no history of accuracy in 2018 the expectation for 2019 was 3.125%, 2020 /3.375% and2021 2.875%. The actual was 2019/1.625 2020/.0125 and 2021 does not look like it will hit its prediction.
Stocks didn't take kindly to the news. The Dow Jones Industrial Average slid the most, shedding 266 points, or 0.8%. The S&P 500 and the Nasdaq Composite declined 0.5% and 0.2%, respectively. As mentioned above the weekly drop was signifdicanlty greater. Meanwhile the yield on the benchmark 10-year Treasury note jumped to 1.569% from 1.498% on the 15th.
Housing Markets
Is a drop in permits warning some cooling ahead?
The Housing starts picked up 3.6% in May to a 1.572-million-unit annual rate, but below the consensus of a 1.63-million. The previous two months were revised down by a total of 60,000 units, on a three-month average basis, which levels out some of the short-term volatility.
Housing starts peaked at the beginning of this year, are still close to their highest level since October 2006. Could this be a problem? Many contractors are now changing the way they are doing business with more open-end contractors to adjust for material prices and delivery dates.
Building permits, usually considered a leading indicator, fell 3.0% to a 1.681-million-unit rate, a seven-month low, and below the consensus of a 1.73-million. While the housing backlog increased 0.8% to 238,000 units, a record high, the high price of materials from supply chain interruptions caused by the pandemic are playing a big role in these numbers
CEO optimism keeps rising
The Business Roundtable CEO Economic Outlook Index increased 9.2 points in Q2 to 116.4, its highest level since Q1 2018, and the second-best reading on record. It was its fourth consecutive increase, reflecting growing optimism about the U.S. economy.
Hiring plans for the next six months reached a record high level. Expected sales and capex plans also picked up. CEOs revised up their projection for real GDP growth for this year to 5.0% from 3.7% previously. Keep in mind that these numbers do not reflect those of the small business owner, who employs much of the American public. Those numbers were discussed last week are significantly less optimistic.
Import price inflation accelerates Import prices increased 1.1% in May, above the consensus of 0.6%. Prices have increased by at least 1.0% in five of the past six months, reflecting stronger demand, supply constraints, and a weaker dollar. As of this writing the DXY (Dollar index) has increased so if that holds its strength prices will drop.
Fuel prices rose 4.0%, while nonfuel prices increased 0.9%, up for the sixth consecutive month. Notably, nonfuel industrial supplies and materials surged a record 4.9%, driven by building materials, unfinished metals, and chemicals.
On a y/y basis, import prices rose 11.3%, the fastest pace since September 2011. Nonfuel import prices surged 6.0% y/y, the most since September 2008. Import prices from all key trading regions were higher than a year ago.
Mortgage applications up
The MBA Refinance Index rebounded 5.5% last week, its first increase in four weeks, while the Purchase Index picked up 1.6%. However, both are off their peaks in early 2021, indicating some moderation in housing demand as soaring home prices have likely kept some potential homebuyers off the market.
A Slow Second Half
With much of the stimulus from Helicoptor money now behind us, recent data are now giving us a glimpse of what the second half of 2021 may hold as far as economic activity is concerned -that is, without a fourth round of free money.
Retail sales fell -1.3% in May (M/M). April was revised up, but it is the direction of change that is important. If one factors in the price increases, retail sales in physical terms actually fell closer to -2.0%. Looking back to the first and second rounds of helicopter money, we saw retail sales turn negative when the stimulus wore off – negative in November and December when the first round of stimulus wore off and again last February when the second round had run its course. Without another round of such funding, and with the federal $300/week supplemental unemployment benefits winding down between June 12 and September 6, retail will likely be flat/down over the year’s second half.
The Labor Markets
The news last week (ending June 19) on the labor front was mixed. Initial Unemployment Claims (ICs), both state and PUA (Pandemic Unemployment Assistance program) reversed their recent downtrends, rising to +520K (Not Seasonally Adjusted) from +438K the prior week.
ICs are a proxy for new layoffs. Many may think this is not a good sign for a “hot” economy; perhaps it. But we do not believe these numbers are an inaccurate telling of the jobs market. We believe that there is a lot of fraud in the system, especially the PUA side, which is provided for 1099 employees. In addition, too many hourly workers take jobs then quit after a few weeks of work. States are not doing their due diligence to verify the accuracy of these claims. As many would tell you, if the mind set is that it’s the Fed's money not the states, there is no incentive by local municipalities to do their job, it doesn't effect them.
The Week Ahead
The Fed’s somewhat surprisingly hawkish shift in rhetoric is having investors question not only the likelihood of rate hikes in 2022 but also their asset allocations. Will the yield curve continue to flatten, pressuring the banks? Are we going to see another spurt from growth stocks, even with small-caps lagging, or will investors just hide out in the largest tech stocks? Time will tell if the inflation trade deflates, despite the Fed’s concerns. Commodities may have a harder time coming back after China announced plans to release reserves of key metals like copper and aluminum. Fed chair Powell‘s testimony will be scrutinized after non-voting FOMC member Bullard’s comments on Friday sent tremors through the markets. The economic calendar offers a little bit of everything, with U.S Existing Home Sales on Tuesday, Manufacturing and Services PMIs from the U.S. and the Eurozone on Wednesday, and another U.S. inflation update on Friday with the PCE Price Index. The second and final U.S. Q1 GDP revision is not expected to see changes. Internationally the focus will be on ECB President Lagarde’s comments today, along with the UK’s monetary policy summary on Thursday.
This article is provided by Gene Witt of FourStar Wealth Advisors, LLC (“FourStar” or the “Firm”) for general informational purposes only. This information is not considered to be an offer to buy or sell any securities or investments. Investing involves the risk of loss and investors should be prepared to bear potential losses. Investments should only be made after thorough review with your investment advisor, considering all factors including personal goals, needs and risk tolerance. FourStar is a SEC registered investment adviser that maintains a principal place of business in the State of Illinois. The Firm may only transact business in those states in which it is notice filed or qualifies for a corresponding exemption from such requirements. For information about FourStar’s registration status and business operations, please consult the Firm’s Form ADV disclosure documents, the most recent versions of which are available on the SEC’s Investment Adviser Public Disclosure website at www.adviserinfo.sec.gov/
The Optimized Investor