
A view from the Observation Deck & Other Economic News
for the Week Ending June 25th 2021

Two weeks ago, the markets took a nose dive based on a reaction to the Feds “Dot-Plot” chart. Last week after thinking through the reactions to the chart, market volatility subsided and the equity markets resumed its upward bias. The headlines of course stated that markets hit all-time record returns. What we have observed, however, is that much of the newly released data, including employment, housing, income, durable goods, and even inflation shows the economy expanding at a much slower speed than markets have assumed. All major indices were in positive territory and the Treasury yield went back to Plus 1.5%. Oil jump $2.5 a barrel and the U.S. Dollar index (DXY) dropped 41 basis points.
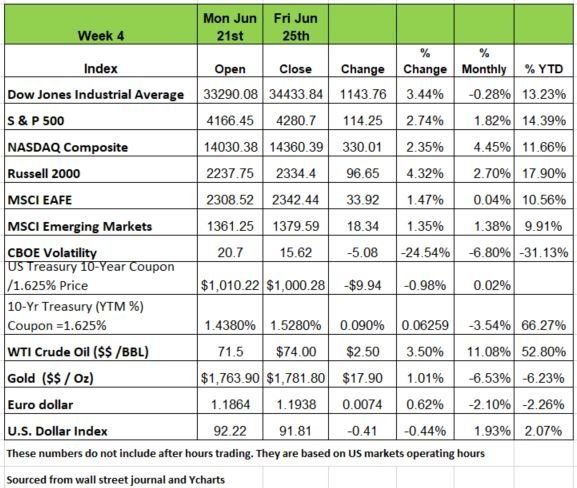
Treasury yields climbed a bit last week as money moved back into the equity side, bonds drop prices to increase yield. In addition, increased inflation expectations and Federal Reserve speculation contributed to the uncertainty. Regional Fed Presidents James Bullard and Rob Kaplan both said on Monday they expect inflation next year to be above the Fed’s target.
Investors were already speculating that the Fed may be more likely to end pandemic era policies sooner and these comments enforced the believe that rate hikes may come as early as late 2022.
Fed Chairman Jerome Powell continued to give a very patient tune in congressional testimony on Tuesday, saying that one needs to be very humble about drawing signals for the economy from “such an unusual setting of reopening the economy” and maintained the belief that inflation pressures are transitory.
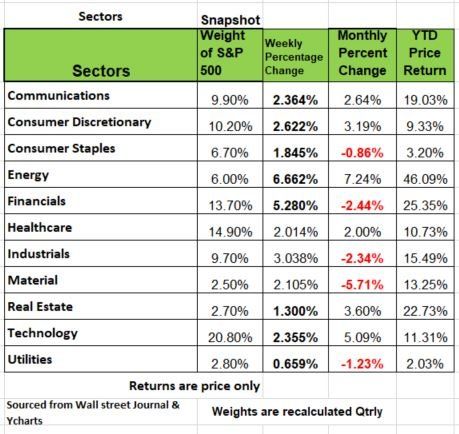
After a broad rally lifted all 11 sectors higher for the S&P 500 index. Energy was the top sector after West Texas Intermediate crude oil prices rallied more than 3.2% rebounding from soft pricing the week before.
Strong economic data also heightened interest rates helping to rally Financials as the second-best performing sector. Banking stocks rallied on Friday after the Fed released the results of their stress test, which all banks passed. Of course, we know that they have too much cash on their books as we have discussed in the past causing a reverse repo on the overnight lending. (The fed is paying the banks now).
Cyclicals (Consumer Discretionary) rallied well as positive economic data from GDP, jobs, consumer sentiment, durable goods, personal income, and personal spending all continue to imply the strength of the US economy. But don’t be fooled, we know better as a strong economy can not exist with 16 MM people still out of work the increase in personal income is from Uncle Sam’s over generously weekly gift.
Employment
Data for the last two reporting weeks (June 12 and June 19) show Initial Unemployment Claims (ICs) (state and Pandemic Unemployment Assistance (PUA)) rising slightly and sitting at the 500K level. This is not an indication of a strengthening economy
The large impacts of the pandemic on economic activity aren’t seasonal and using historical seasonal adjustment (SA) factors makes little sense.
Yet, markets and the financial media appear stuck on the SA data. Because the PUA program hasn’t been around long enough to calculate seasonal factors, the financial media only widely reports on the state headline SA numbers.
The markets seem to be ignoring or blind to the real data, perhaps the traders are spending too much time listening to the media. In fact, it isn’t clear that some in the financial media actually understand what the data means. Here is the opening paragraph of a story put out by one of the major financial media outlets:
Initial Claims for unemployment insurance remained elevated last week as employers struggled to fill a record number of job openings.
As we have reminded our readers employment data, ICs are a proxy for new layoffs. Why would employers struggling “to fill a record number of job openings” be laying people off? That 500K number is 2.5 times the pre-pandemic “normal,” and indicates that layoffs are still at recessionary levels! The story writer appears to be confusing ICs with Continuing Unemployment Claims (CCs), which also continues to be elevated and showed no downward movement in the last data release. But no one ever accused the media of being accurate in their reporting. The only part of a story that matters is the headline.
Housing
Housing is a very heavily weighted & important input in the GDP calculation. Housing also employs a significant percentage of workers. So a weakening housing sector is not a good sign let alone that of a “roaring” economy.
Again, the financial media screams about housing prices. And well they should. The median price of a single-family home rose 18% Y/Y (May) with price increases accelerating over the past six months.
The financial media blames the falling data solely on price (i.e., the “inflation narrative”). No doubt, that is a major factor. But there may be other causes at play. Now that vaccines appear to be working, re-openings occurring, and some companies calling much of their workforce back to the office, demand for those suburban homes may have peaked. For those living in major metropolitan areas like NYC, Chicago and San Francisco. The inventory numbers would seem to indicate that. In terms of months’ supply, May showed 5.1 months, about 1.5 times higher than October’s 3.5 months.
The actual reasons for housing’s slowdown don’t really matter. What matters is that the peak is in (or, at least, appears to be) and that means slower economic growth in 2021’s second half. Has that been priced into financial markets? We don’t think so!
Other Data and Musings
Durable goods orders rose +2.3% M/M in May. It missed the consensus number of +2.8%. Aircraft sales are significant here, as aircraft orders were spurred by the return of domestic travel to about 75% of its pre-pandemic level, as airlines, now needing planes, pulled the “buy” trigger. Ex-aircraft, the M/M increase was only +0.3% (consensus: +0.7%).
In addition, core capex orders (these are non-defense capital goods less aircraft) fell -0.1% (consensus: +0.6%). Adjusted for inflation (i.e., an estimate of physical sales), the number was -1.6%. Note here how much lower the data is than consensus, indicating that the financial markets are still too bullish on the recovery.
Consumer spending was flat in May (0.0%)( consensus: +0.4%), and personal income fell -2.0%. The impact of the stimulus is clearly fading.
The SF Fed published a study that concludes: 1) Covid distortions have added 2.4 percentage points to core inflation in 2021 through April; 2) Non-Covid sensitive core PCE is about 1%. Data like this is the reason the Fed sees today’s PCE inflation rate (+3.4% Y/Y; +0.5% M/M) as “transitory.” [Note: The energy component of the PCE deflator is up +27.4% Y/Y (plummeting gasoline prices a year ago?). OPEC meets soon with some energy gurus indicating pressure for increased production from some members.]
A recent (May 31, 2021) paper by Michael Lebowitz (of 720 Global) entitled “What the Coming Fed Taper Means for Bonds and Stocks,” demonstrates that since quantitative easing (QE) was introduced by Bernanke during the Great Recession, bond yields have fallen (stock prices, too) when the Fed tapers (i.e., purchases lower dollar amounts of bonds each month – currently $80 billion of Treasuries and $40 billion of mortgage-backed securities each month). The Fed is now “talking about” tapering. This is yet another reason for our forecast for lower bond yields over the coming quarters. Source Bob Barone PhD. Economist
Americans Are Leaving Unemployment Rolls More Quickly in States Cutting Off Benefits
Some Missouri businesses see uptick in applications after state set a June end to pandemic jobless aid
The number of unemployment-benefit recipients is falling at a faster rate in Missouri and 21 others states that terminated the enhanced and extended payments this month. This suggest that ending the aid is pushing more people back into the work force.
Federal pandemic aid bills boosted unemployment payments by $300 a person each week and extended those payments for as long as 18 months, well longer than the typical 26 weeks or less. The benefits are set to expire in early September, but almost half of the states have opted out.
While the benefits were helpful during the height of the pandemic, their continuation has “worsened the workforce issues small business owners are facing. Source: https://www.wsj.com/articles/americans-are-leaving-unemployment-rolls-more-quickly-in-states-cutting-off-benefits-11624786202?mod=hp_lead_pos1
Why Two Leading Inflation Gauges Show Different Results
The consumer price index rose 3.9% YOY in May according to information released the commerce department on Friday.
This may seem like a big jump but compared to the 5% jump registered by a Labor Department measure released two weeks ago it’s a lot smaller.
So why such a big discrepancy? Well each is an official government consumer inflation gauge, but like all things in the government they are constructed differently and hence yield different results.
While they tend to move in the same general direction over time, Labor’s consumer-price index, or CPI, typically runs a bit higher than Commerce’s price index of personal-consumption expenditures, or PCE index.
Both rose significantly more in the past year than in recent years before the Covid-19 pandemic. Remember the pandemic caused prices to plunge in the spring of 2020 as many businesses shut down and consumers hunkered down at home. So what that translates to is a low baseline to measure current numbers against. You don’t have to be a brain surgeon to figure out why the increases in both indexes were the biggest in nearly 13 years.
How do the two indexes differ? Well to start, they attempt to measure different universes of spending. The CPI tries to capture changes in the cost of living based on what urban consumers pay out of pocket for a hypothetical basket of goods and services. This would include Food, Rent, Clothing, Insurance transportation. Etc.
The PCE index uses a broader basket of price changes, which includes rural areas. It also includes prices paid by nonprofit organizations that provide services to households, government programs such as Medicare and Medicaid and by employer-sponsored health care plans. Source: https://www.wsj.com/articles/why-two-leading-inflation-gauges-show-different-results-11624627509
Inflation Rate Calculator: Customize Your Own Consumer-Price Index
In the previous article we address the difference in two different inflation numbers. But the truth is inflation does not impact all people equally. We are not distinguishing the difference between economic social classes but within each class. You and your friend making approximately the same amount of money will be impacted differently.
The figure is supposed to tell consumers how much more money they will need to spend to buy the same amount of goods and services, including clothes, groceries, restaurant meals, recreational activities and vehicles. So, for example, you might use a car every day while your friend might take public transportation or Bike ride. You dinning habits might vary as well as your style of dress.
In general, consumers tend to notice price increases in the goods and services they purchase most frequently, such as food and gasoline, and not so much for things like appliances, or other less-frequent purchases.
But over the past year, our spending patterns for gas and food changed. Everything was interrupted. Remember last May Oil was in negative territory since there was no room to store fuel.
If you were around in the late 1970’s and early 80’s you are fully aware of the struggled the U.S. had with high inflation. Inflation peaked in April 1980 at 14.76%. Followed by years of generally low and stable inflation followed. Today, the Federal Reserve’s goal for inflation is 2%. In April, prices rose by the most in any 12-month period because the baseline was so low. As a financial planner I am always amazed at the number of people that wing their finances. If you really want to know how much inflation has impacted your life, take the time to do the math. Look at what your spent last year and what yu saved compared to 2019. The compare those numbers to 2021. We would bet you’re still ahead in the game. Source: https://www.wsj.com/articles/inflation-rate-calculator-customize-your-own-consumer-price-index-11621503004?mod=series_inflation
It’s Time for a Midyear Review of Your Finances. Here Are 4 Areas to Focus On
If you’re a sports enthusiast then you’ll understand what I mean when I say its half time?
Like most professional coaches they analyze the results of the first half, review mistakes and address them.
Its no different with your finances. Do a mid-year check up!
Calculate your income and expenses: I
f you’re not already doing so, make sure to create a personal cash flow statement to provide a snapshot of what’s coming and going out on a monthly basis. This is especially important since things may have changed due to the pandemic.
Careful tracking can help you better understand spending patterns, waste, and if you care where cuts and extra savings may be possible.
Do an asset allocation assessment:
Look at all your accounts to make sure your asset mix hasn’t gotten out whack. Be careful if your portfolio is on auto pilot, where your portfolio is rebalancing on its own. This may not be too wise especially if you started late in life. Many people don’t pay close attention to asset allocation but more importantly they don’t know what the underlying assets are. If your portfolio is full of index ETF’s or Mutual Funds. Chances are there is overlap/ redundancy in your portfolio. But more importantly in this environment with low interest rates an allocation that worked for a 50-year-old 10-15 years ago does not work the same today. Fixed income assets are just as volatile as equities and the returns tend to be a lot lower. Make sure your portfolio is delivering what your financial plan requires in order to hit your retirement goals.
Conduct a tax audit:
There are many tax-related changes being discussed as a result of the new administration, but even if the status quo remains, people still need to think about their tax situation.
Take a look at your State’s financial health or your city’s. The pandemic wreaked havoc on many municipalities already financially stressed. Expect an increase in property taxes, especially if you live in Chicago and other parts of IL. Look at your savings account? Do you have one? Could you be saving more in tax-sheltered options, for instance? And if you’re over 50, are you taking full advantage of catch-up savings options?
Do an insurance checkup
Are you properly insured? Are you paying too much for coverage not used, take a look at your home auto and medical coverage? If you haven’t had any major claims in the last few years increase your deductible. Your saving might offset the deductible. Shop out the insurance you may find a big savings by moving to another carrier and use that savings to put in your savings account. Source: https://www.barrons.com/articles/its-time-for-a-midyear-review-of-your-finances-here-are-6-areas-to-focus-on-51624655408?mod=djem_b_retirement0627
The Week Ahead
Markets experienced some volatility around the second biggest options expiration ever on June 18, and this week brings a couple of comparable large-scale events to watch. First there’s the typical window dressing that can occur at quarter end. The S&P500 is up about 7.5% QTD, which may necessitate some asset allocation shifts. Secondly, the annual Russell rebalance that took place after Friday’s close could add volume-driven uncertainty to the mix. The economic calendar is light early this week, highlighted by U.S. Consumer Confidence and China Manufacturing PMI on Tuesday, followed by Chicago PMI, U.S. pending home sales, Eurozone CPIs, and Canadian GDP on Wednesday. After the quarter ends there’s a busy slate heading into the July 4th weekend. Oil traders will be eyeing the OPEC meetings on Thursday, while Manufacturing PMIs are scheduled for the U.S. and the Eurozone. The ADP employment report from earlier in the week will be bookended by Friday’s U.S. jobless claims, expected to dip back below 400,000, as well as the BLS non-farm payrolls and unemployment rate
This article is provided by Gene Witt of FourStar Wealth Advisors, LLC (“FourStar” or the “Firm”) for general informational purposes only. This information is not considered to be an offer to buy or sell any securities or investments. Investing involves the risk of loss and investors should be prepared to bear potential losses. Investments should only be made after thorough review with your investment advisor, considering all factors including personal goals, needs and risk tolerance. FourStar is a SEC registered investment adviser that maintains a principal place of business in the State of Illinois. The Firm may only transact business in those states in which it is notice filed or qualifies for a corresponding exemption from such requirements. For information about FourStar’s registration status and business operations, please consult the Firm’s Form ADV disclosure documents, the most recent versions of which are available on the SEC’s Investment Adviser Public Disclosure website at www.adviserinfo.sec.gov/
The Optimized Investor