
Weekly Market Review
for March 4th 2024

The content of this Newsletter is to provide you with Economic insights to assist you in making better decisions with your investments. Unlike many other financial periodicals we will not mention specific companies, unless it is relevant to an overall economic issue. We welcome your questions on economic concerns and will address in our newsletter. just email us at info@optfinancialstrategies.com #FinancialAdvisor,#investmentmanagement #wealthmanagement #financialplanning #retirementplanning #401kplans
Week In Review
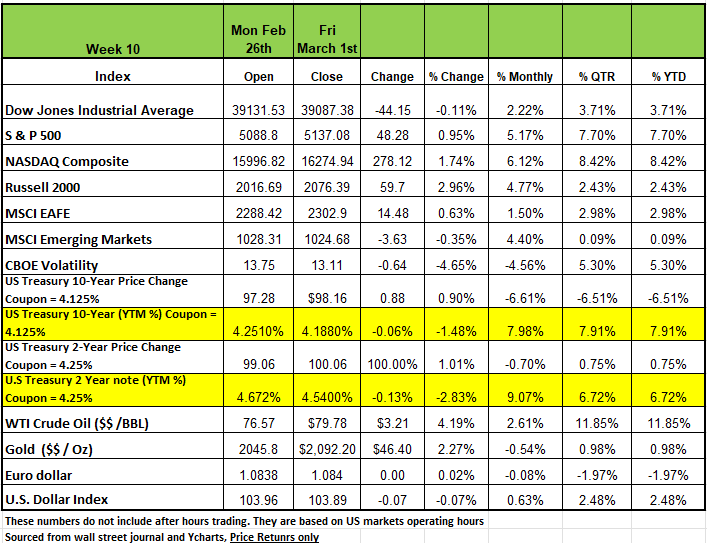
Equities had a good week with the Russell 2000 posting the highest return on the week +2.96%, the S&P 500 and NASDAQ Composite returned +0.95% and +1.76% respectively, bringing both to new all-time highs. The DOW was the only index with a negative return on the week posting -0.11%
The S &P index rose to a fresh record close last week as a technology-driven rally helped the market benchmark end February and kick off March on a positive note.
The index ended Friday's session at 5,137.08, up from last Friday's closing level of 5,088.80, which was a record at the time. It reached another closing high on Thursday as the index ended February with a 5.2% gain before moving higher on Friday. The index also set a fresh intraday high on Friday of 5,140.33.
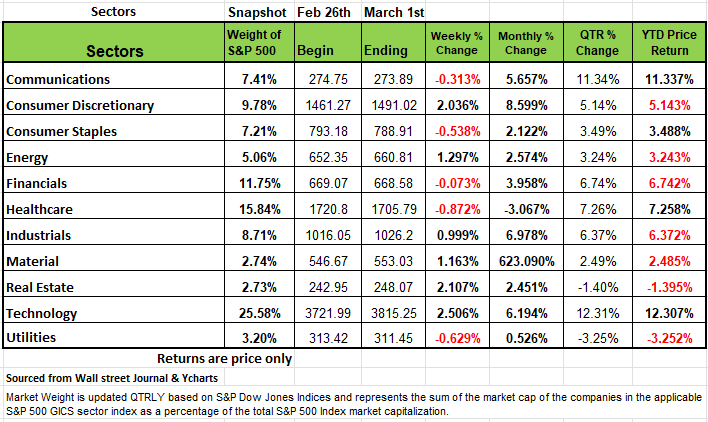
Information Technology sector drove the S&P 500 higher last week returning +2.52%, NetApp Inc. was the top performer shooting up +20.49% following its earnings release last Thursday. The data-storage company found strength after it beat earnings across the board and raised guidance, management signaled strong demand despite the current macroeconomic backdrop and while generative AI mix is currently small it’s trending in the right direction earlier than originally anticipated.
The technology sector led the climb following stronger-than-expected fiscal Q4 results last week from chip maker NVIDIA (NVDA). Strong demand for NVIDIA's generative artificial intelligence or AI helped boost investors' appetite for many other stocks in the AI realm.
Adding to the AI excitement this week, Dell Technologies (DELL) reported a surprise increase in Q4 earnings as revenue also came in above analysts' expectations and Chief Operating Officer Jeffrey Clarke said the company saw strong demand continue for its AI-optimized server portfolio.
The worst performing sector in the index was the Health Care sector which fell -1.04%, its worst performer was Insult Corp. which fell -8.12%. The insulin device maker fell following its earnings release, it beat estimates across the board, but guidance fell short of analysts’ expectations.
Treasury yields were down across the board following a busy week of economic reports. New single-family home sales increased 1.5% in January, falling short of consensus expectations. New home sales have risen for the second month in a row, as the anticipation of Fed rate cuts this year bolstered sales activity over the past couple of months.
New orders for durable goods declined -6.1% in January, lagging the consensus expected -5.0%. The largest decline came for orders of commercial aircraft as it led declines across most major categories. On Wednesday, the first revision of 4th quarter GDP showed the economy grew at a robust 3.2%, slightly lower than the prior estimate of 3.3%. “Core” GDP (personal consumption, business fixed investment, and home building) rose at a respectable 2.9% annual rate in Q4.
Data released on Thursday showed personal income rose 1.0% while personal consumption rose 0.2% in January. The overall PCE deflator was up 0.3% in January and is up 2.4% in the past year. On Friday, the ISM Manufacturing Index declined to 47.8 in February, falling short of the consensus expected 49.5. The majority of industries reported a contraction or no change for the month, and this now marks the sixteenth consecutive month that overall activity has contracted.
By Sector
Six of the 11 sectors finished in the black last week, as mentioned above the technology sector climbed +2.5%, followed by a +2.1% rise in real estate and a +2% increase in consumer discretionary. Other gainers up by at least 1% each included energy, materials and industrials. The big losers on the week were Healthcare- 0.872% followed by Utilities -0.629% Consumer Staples -0.54%, communications 0.313% and Financials 0.07%
Gainers in the tech sector included shares of NetApp (NTAP), which soared 20% on the week as the company reported fiscal Q3 adjusted earnings and revenue above analysts' expectations.
In real estate, shares of American Tower (AMT) rose 6.2% as the company reported Q4 adjusted funds from operations above analysts' expectations while revenue also topped the Street view.
In consumer discretionary, shares of Norwegian Cruise Line (NCLH) jumped 19% as the cruise operator reported stronger-than-expected Q4 revenue amid healthy consumer demand and turned its first full-year profit since 2019.
On the downside, the health care sector fell 1%, followed by a 0.6% drop in utilities and a 0.5% decline in consumer staples. Communication services and financials also edged lower.
Shares of UnitedHealth Group (UNH) shed 7.2% amid a Wall Street Journal report that the health insurance provider is facing an antitrust investigation launched by the US Department of Justice. The investigation is looking into the possible effects of the company's doctor-group acquisitions on rivals and consumers, the report said.
Next week, economic reports earlier in the week will include January factory orders and wholesale inventories, but most attention will be on the February employment report due on Friday.
Market Recap
Now that fourth-quarter earnings season is almost over we can see that corporate America did well, there was no disappointment on earning for most companies. With nearly all of the S&P 500 companies having reported results as of the writing of this article, the vast majority exceeded consensus revenue and earnings-per-share forecasts and this was reflected in a boost in stock prices.
This marked the second-straight quarter of profit gains for the S&P 500 Index and, maybe more importantly, company projections kept the forecasts for high-single-digit earnings growth in 2024. We do believe that companies will need to sustained these profit gains to justify the high price-to-earnings multiple for the index which is currently 24.84.
The anticipated artificial intelligence (AI) revolution has had a positive impact of on the stock market’s performance over the last several months. Wall Street was eagerly awaiting the quarterly results of NVIDIA, which produces high-powered memory chips to run AI platforms, and the semiconductor giant delivered impressive profit growth. This lifted the technology sector and the major averages to record highs, reminding market pundits of the dot.com euphoria that once captivated Wall Street. The question is whether or not the tech sector is in a bubble. NVIDIA’s outlook suggests that the AI-powered surge in the equity market has more room to run.
The U.S. economy continues to exceed expectations. The unprecedented stimulus measures coming out of the pandemic, which flooded the financial system with liquidity, the still-tight labor market, and the overall downward trend in inflation continue to support consumer spending. This backdrop puts less pressure on the Federal Reserve to pivot on the interest-rate front. It should be noted that the January reading on the Personal Consumption Expenditures Price Index, the assessment of inflation most closely monitored by the Federal Reserve, was as expected up 0.4% for the month and YOY 2.8%. this coming on a jump in personal income of 1% in January
The Minutes from the latest Federal Open Market Committee (FOMC) meeting showed more hawkish attitude. Our sense is that the central bank does not want to reverse monetary policy course prematurely and risk seeing price growth reaccelerate as it begins to cut rates. This scenario proved problematic for the lead bank and the economy in the late 1970s. February CPI numbers will be released next week on March 12th
Major equity averages were at record highs as earnings season drew to a close, much is fueled by the AI buzz and the expectation that the Fed will begin loosening monetary policy later this year. We still think a portfolio consisting of high-quality stocks and cash is the best way to play this extended market. Better to be cautious.
A Technical Perspective
Most of last year’s gains were made by a few of the market’s largest names, which were also the same stocks that were some of the worst performers in 2022. This year, we are beginning to see broader market participation. Recently, the Advance-Decline Line of the S&P 1500 index, which measures the number of stocks increasing versus decreasing, broke out to a new high. This is a measure of market breadth. It is better to see a rising tide lifting all ships, as opposed to just a few large stocks.
With broader market participation, some of the largest technology and previously strongest stocks have begun to show relative weakness. At least three of the Magnificent 7 stocks are beginning to slip and show weakening relative strength to the broader market indexes. This is something to keep an eye on, given the heavy impact that technology stocks have on the market’s movements.
Now that the market breadth is improving, we are beginning to see some of the previously weaker mid and small cap stocks show early signs of strength. In addition, some strength in stocks is coming from sectors outside of technology-related sectors. Stocks like Procter and Gamble have been featured in previous market commentaries. Additionally, we continue to keep a close eye on the Energy sector, as it attempts to break out some resistance.
Chart of the Weak- Gold
Let’s turn our attention away from the equity markets. This week’s chart of the week is Gold. To analyze gold’s technical aspects, we will be looking at a gold ETF, GLDM.
When it shows positive characteristics, gold can often be a “diversifier” within a portfolio. Contrary to popular belief, correlations of securities will change over time. There is an assumption in markets that gold and bonds will move in opposite directions of one other. There will still be periods when gold experiences positive, negative, or no correlation to bond securities and equities.
Looking at weekly data for the last six months, Gold has had mainly positive correlation to both stocks and bonds, while showing a few positive technical characteristics.
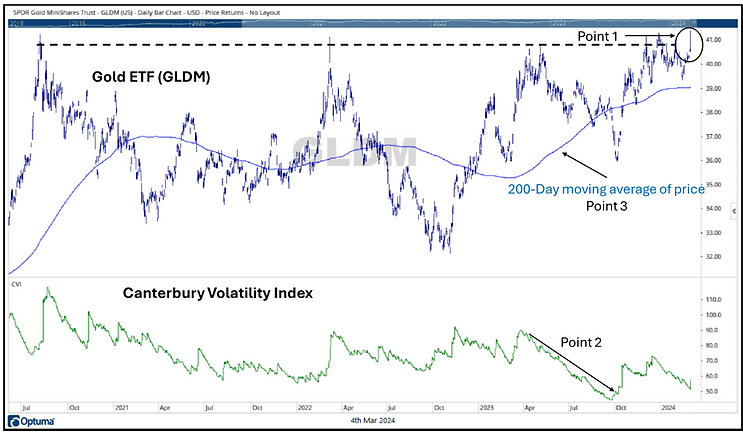
This Gold ETF recently set a new all-time high. After a large sideways trend that has occurred for the last few years, GLDM matched its old high in December. After a small consolidation, GLDM broke out to a new all-time high on Friday and continued the move into Monday.
During a decline that occurred from April to October 2023, the volatility of Gold (as measured by a Volatility Index) also declined. This is uncommon during a decline in price. Since then, Gold has rallied and seen some large upward moves. Now, volatility is once again declining as the ETF sets a new high.
The blue line is Gold’s 200-day moving average of price. As Gold moved sideways, this line also fluctuated sideways. Now, as gold has set a new high, this line has seen a steady uptrend. Moving averages indicate long-term trends.
One positive point is that we are beginning to see broader participation in the markets, but on the other hand, it is concerning that technology stocks are no longer leading. While several tech stocks continue to look strong, some are showing signs of weakness. Given the market’s heavy skew towards technology stocks, if technology stocks begin to fall off, that could pose some issues for the markets.
Portfolio management is about maintaining stability. It would not be efficient to have a portfolio of 500 stocks but put a quarter of your money into just seven of them. That is what the S&P 500 has done. More stocks rising creates opportunities to identify securities with the supply and demand characteristics of stocks that want to go up. Our team at Canterbury continues to do that, and has taken recent positions in Procter and Gamble, Dover Corporation, and Gold.
As markets fluctuate, the risk characteristics will also change. As those characteristics shift, it is important that your investment portfolio remains adaptive. An Adaptive portfolio is capable of moving in concert with everchanging market environments- bull or bear. Source Brandon Bischoff Canterbury Investments
The Week Ahead
Inflation data has tended to dominate the headlines in recent weeks, but this week’s U.S. jobs picture will also be crucial for the Fed’s policy path. January’s much stronger than expected increase in non-farm payrolls contributed to investors pushing back the timeline of rate cuts, as measured by fed funds futures. Although Friday’s February report is forecasted to be weaker, it will likely point to an economy that continues to bustle. Wage growth is also expected to moderate to +0.3% from +0.6%.
The ADP private payrolls and JOLTS job openings will be released on Wednesday. Fed Chair Powell will begin his two-day testimony before Congress mid-week, where he will be grilled on the economy, interest rates, and inflation. Other U.S. data of note include ISM Services PMI and factory orders on Tuesday and consumer credit figures on Thursday. Retail earnings announcements to watch involve Target, Costco, and Abercrombie & Fitch. The international calendar features central bank decisions from Europe and Canada.
The European Central Bank is likely to leave rates unchanged, so the focus will be on updated economic projections and the timing of rate cuts, which markets are projecting to begin in June. Germany’s industrial production and factory orders along with Eurozone PPI and retail
sales will also be released this week. Inflation in Canada has slowed considerably, giving the Bank of Canada an opportunity to lay the groundwork for rate cuts this summer. In Asia, the latest inflation numbers from Tokyo will arrive later tonight, while China’s government will announce its 2024 growth target ahead of trade balance and inflation numbers later this weeK
This article is provided by Gene Witt of FourStar Wealth Advisors, LLC (“FourStar” or the “Firm”) for general informational purposes only. This information is not considered to be an offer to buy or sell any securities or investments. Investing involves the risk of loss and investors should be prepared to bear potential losses. Investments should only be made after thorough review with your investment advisor, considering all factors including personal goals, needs and risk tolerance. FourStar is a SEC registered investment adviser that maintains a principal place of business in the State of Illinois. The Firm may only transact business in those states in which it is notice filed or qualifies for a corresponding exemption from such requirements. For information about FourStar’s registration status and business operations, please consult the Firm’s Form ADV disclosure documents, the most recent versions of which are available on the SEC’s Investment Adviser Public Disclosure website at www.adviserinfo.sec.gov/
The Optimized Investor
