
Some underlying issues in this Bull Market
&
Other Economic News for the
Week Ending 12-10-2021

It's hard to believe that we are quickly approaching the end of the year. Another year of COVID & Confusion. The media seems to be the driving force behind the majority of our problems. Never letting an insignificant issue go if you can scare the public .
The equities markets rallied from the previous week by returning +4.02% from the DOW, +3.82% from the S&P and 3.61% from the NASDAQ. The Russell 2000 posted the lowest return of 2.43%. Again, these are only price returns, but substantial in the face of higher inflationary numbers and the media sensationalizing the Omicron variant. Every sector in the S&P 500 was positive, led by technology (+5.98%), consumer staples (+3.5%), and basic materials (+3.5%). Crude oil jumped nearly 9%+ to scale back above $70 per barrel. Gold dropped -6.3%.
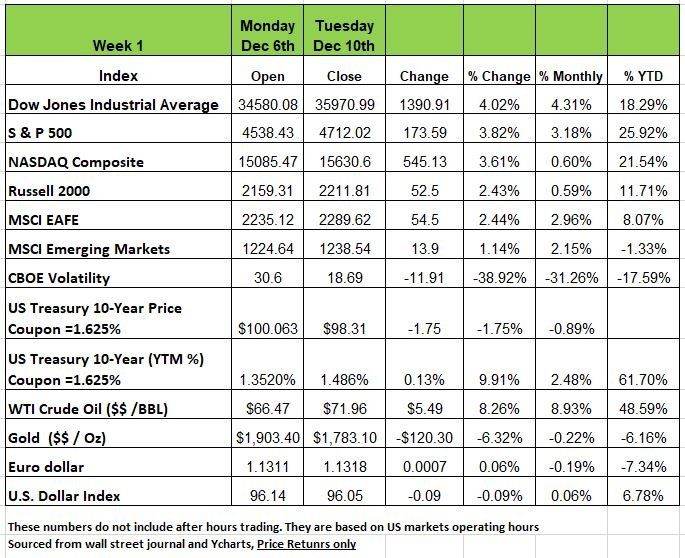
U.S. Treasury bond yields increased across the yield curve last week. Yield increases were led by the longer maturity end of the yield curve, which saw the largest weekly yield increases in months. At the end of the week, investors turned their attention to inflation data, which has been a key topic as the economy navigates COVID-19 related headwinds.
The Consumer Price Index, or CPI, increased 0.8% in November, which came in 0.1% higher than expected. The CPI is up nearly 6.8% versus a year ago with real average hourly earnings down nearly 2% on the year. Though the CPI report was largely in-line with expectations, Friday’s CPI data further supports the realization that inflation is not transitory and puts an even more critical eye on next week’s FOMC meeting.
On the labor front, job quits declined by 4.7% in October while openings moved back up to 11.03M, up 4.1% MoM and just below the all-time high. Weekly jobless claims sank to a multi-decade low of 184K. Paychecks and hours worked grew in Q3, but productivity slumped 5.2%, worse than initial reports.
China’s central bank moved to stabilize concerns about its property market, lowering the bank reserve requirement by half a point to 8.4%, as Fitch declared that real estate developer Evergrande was in default. China’s factory gate inflation cooled slightly in November, with PPI increasing 12.9% YoY versus 13.5% the prior month, and CPI rising 2.3% YoY versus expectations of 2.5%.
Exports fell in November while imports jumped on increased commodity demand. In Europe, German factory orders dropped 6.9% MoM in October, and economic sentiment slipped to 29.9 from 31.7, clouding the growth outlook. Australia’s central bank gave an optimistic view of the financial recovery while resisting pressure to move more quickly on winding down stimulus. Similarly, the Bank of Canada avoided shifting to a more hawkish stance despite recent strong economic reports.

Labor Productivity
According to the U.S. Bureau of Labor Statistics, Nonfarm business sector labor productivity decreased 5.2 percent in the third quarter of 2021 as output increased 1.8 percent and hours worked
increased 7.4 percent. This is the largest decline in quarterly productivity since the second quarter of
1960, when the measure decreased 6.1 percent. (All quarterly percent changes in this release are
seasonally adjusted annual rates.) From the third quarter of 2020 to the third quarter of 2021, nonfarm
business sector labor productivity decreased 0.6 percent. This four-quarter rate is the largest decline
since the fourth quarter of 1993, when the measure also declined 0.6 percent.
Unit labor costs in the nonfarm business sector increased at an annual rate of 9.6 percent in the third
quarter of 2021, reflecting a 3.9-percent increase in hourly compensation and a 5.2-percent decrease in
productivity. Unit labor costs increased 6.3 percent over the last four quarters. Not a good sign.
The BLS calculates unit labor costs as the ratio of hourly compensation to labor productivity. Increases in hourly compensation tend to increase unit labor costs and increases in productivity tend to reduce them. Labor productivity, or output per hour, is calculated by dividing an index of real output by an index of hours worked by all persons, including employees, proprietors, and unpaid family workers.
In the third quarter of 2021, both output and hours worked increased for the fifth consecutive quarter following historic declines in those measures in the second quarter of 2020. The output index is now 1.8 percent above the level seen in the fourth quarter of 2019, the last quarter not affected by the COVID- pandemic, while the hours worked index remains 1.0 percent below its fourth quarter 2019 level.
The nonfarm business labor productivity index is 2.8 percent higher in third-quarter 2021 than it was in
fourth-quarter 2019, corresponding to an annualized growth rate of 1.6 percent during the pandemic
period of fourth quarter 2019 through third quarter 2021. This rate is slightly higher than the 1.4-percent average annual growth rate during the previous business cycle--from 2007 to 2019--but below the long- term average rate since 1947 of 2.1 percent. Source https://www.bls.gov/news.release/prod2.nr0.htm
Money and The Fed’s Upcoming Policy Deliberations
For fifty years markets have paid lip service to Milton Friedman’s observation that “inflation is always and everywhere a monetary phenomenon.” Based on historical observations, it takes approximately nine months for monetary policy to really impact the economy.
Given the deceleration in M2 since September (tapering QE) if the relationship continues to hold, the growth in the CPI will decelerate going forward. The Fed meeting (December 13-14) of this week, will find themselves at a critical juncture, and a policy misstep could have major financial impacts.
Recently, Fed Chair Powell has “pivoted” again, adopting a more “hawkish” stance on inflation. Perhaps this was due to the unrelenting financial market pressure, or perhaps for political reasons (to let the public know the administration will “fight” inflation). The data we have leads us to believe that neither the economy nor the labor markets are as strong as the financial media “narratives” would have us believe. Much of the data presented in the media is framed to give a particular picture of our economy. We try to look deeper into the numbers to get a more realistic picture of where we might be heading.
Financial markets react to changes in Fed policy quickly. So, if the “inflation” narrative causes the Fed to tighten, there will likely be significant reactions in both the equity and fixed income markets (Keep an eye on the DXY as a metric on how strong the U.S. dollar is to a basket of other currencies). In the current setting, the reaction could be magnified because record amounts of leverage underpin all asset classes. An unwinding of such leverage will magnify market movements.
Here is the danger: if the economy turns out to be weaker than anticipated (disappointing December Retail Sales, a weaker labor market, falling demand for big ticket items), premature Fed tightening would be a major policy misstep, could send the economy into recession.
Market Risks
Today, the equity and real estate markets are at nose bleed levels:
The S&P 500 P/E ratio is 5+ multiple points above its long-term average.
The Shiller CAPE Ratio (Cyclically Adjusted PE Ratio) is three standard deviations above its mean; it has only been higher in the dot.com bubble era.
Residential Real Estate – today it takes eight years of average income to purchase a single-family home; the historical average is 5.5 years.
Commercial Real Estate – the capitalization rates are so low that there is no compensation for risk in this market.
A Fed policy mistake could have significant financial implications.
Source: Robert Barone, Ph.D.
Labor Productivity
According to the U.S. Bureau of Labor Statistics, Nonfarm business sector labor productivity decreased 5.2 percent in the third quarter of 2021 as output increased 1.8 percent and hours worked
increased 7.4 percent. This is the largest decline in quarterly productivity since the second quarter of
1960, when the measure decreased 6.1 percent. (All quarterly percent changes in this release are
seasonally adjusted annual rates.) From the third quarter of 2020 to the third quarter of 2021, nonfarm
business sector labor productivity decreased 0.6 percent. This four-quarter rate is the largest decline
since the fourth quarter of 1993, when the measure also declined 0.6 percent.
Unit labor costs in the nonfarm business sector increased at an annual rate of 9.6 percent in the third
quarter of 2021, reflecting a 3.9-percent increase in hourly compensation and a 5.2-percent decrease in
productivity. Unit labor costs increased 6.3 percent over the last four quarters. Not a good sign.
The BLS calculates unit labor costs as the ratio of hourly compensation to labor productivity. Increases in hourly compensation tend to increase unit labor costs and increases in productivity tend to reduce them. Labor productivity, or output per hour, is calculated by dividing an index of real output by an index of hours worked by all persons, including employees, proprietors, and unpaid family workers.
In the third quarter of 2021, both output and hours worked increased for the fifth consecutive quarter following historic declines in those measures in the second quarter of 2020. The output index is now 1.8 percent above the level seen in the fourth quarter of 2019, the last quarter not affected by the COVID- pandemic, while the hours worked index remains 1.0 percent below its fourth quarter 2019 level.
The nonfarm business labor productivity index is 2.8 percent higher in third-quarter 2021 than it was in
fourth-quarter 2019, corresponding to an annualized growth rate of 1.6 percent during the pandemic
period of fourth quarter 2019 through third quarter 2021. This rate is slightly higher than the 1.4-percent average annual growth rate during the previous business cycle--from 2007 to 2019--but below the long- term average rate since 1947 of 2.1 percent. Source https://www.bls.gov/news.release/prod2.nr0.htm
What is happening beneath the calm surface of the bull market?
As we head into the end of the year, many are thinking that 2022 to continue the momentum of 2021. If you haven’t been paying much attention, the market is currently sitting near all-time highs. While it has risen nearly 26% this year, there were a few normal 5% corrections along the way, but they were short lived. But when we look deeper in to the S&P index, we find more market losers than winners and why we think it's important for you to pay attention to your money and understand the underlying investments.
Market Cap Weighted Illusion
A market cap index fund is an illusion. It’s of the problems with the financial markets, It’s an illusion of performance. This illusion gets created by the largest market capitalization-weighted stocks. (Market capitalization is calculated by taking the price of a company multiplied by its number of shares outstanding.) Apple, Google, Microsoft, JP Morgan, Tesla, Amazon, Nvidia, Facebook, United Healthcare etc. Except for the Dow Jones Industrial Average, the major market indexes are weighted by market capitalization. Therefore, as a company’s stock price appreciates, it becomes a more significant index constituent. This means that price changes in the largest stocks have an outsized influence on the index. In addition, investment dollars are also weighted to that stock’s percentage weight in the index i.e. if Tesla is 7% of the S&P then 7% of your money is going to Tesla. This is different than equal weighted Indexes that have the same dollar allocation in each security.
Currently, the top-10 stocks in the S&P 500 index comprise more than 33% of the entire index. In other words, a 1% gain in the top-10 stocks is the same as a 1% gain in the bottom 450.
Another look at the contribution skew is to compare how many companies it would take to comprise the same weighting as the top 10. So, out of 500 stocks, the bottom 432 stocks comprise the same market capitalization as the top-10. Note that this changes daily as market /security prices change.
If we look below the surface, the damage seems evident. Without the support of the top-10 holdings, the year-to-date returns and overall volatility would be significantly different. But in looking at those companies that ran hot in 2020 and influenced the index also contributed to the declines this past year. Take Peloton down 77% from its 52-week high. There are a lot more examples like this.
In fact a vast majority of 2020 and early 2021’s high-flying stocks are down significantly from their respective 52-week highs. Probably one of the best representations of the disparity between the index and below the surface trouble is the ARKK Innovation Fund (ARKK). In 2020, the media proclaimed Cathie Wood the top investor of the year. Millennials and Gen Z investors poured money into her fund to chase the upcoming technology stocks of the next generation. Unfortunately, that turned out to be a bad bet. While the S&P 500 index is up roughly 25% in 2021, ARKK is down more than 20%. That is quite a performance differential but shows the disparity between the mega-cap companies and everyone else. (most laggers who tend to buy high and sell low and think the ride will last forever resulting in losses)
It is NOT just the “meme” stocks that significantly underperformed the index. If you owned a diversified portfolio of small, mid, emerging, and international stocks, performance significantly lagged the S&P 500 index. Such is why downturns in the market tend to be a “wipe-out” rather than a “pullback.” A good example recently was Docusign (DOCU).
The point you should take away from this opinion is the significant risk posed to investors with capital hiding in a handful of stocks. Over the last several weeks, we noted the “lack of liquidity” in the markets, along with weak breadth.
The stock market is a function of buyers and sellers agreeing to a transaction at a specific price. Or rather, “for every seller, there must be a buyer.” When there are not enough buyers at current prices to absorb an increase in selling pressure, prices gap down. While there are indeed buyers for every seller, they are at significantly lower prices.
However, during these “wipe-outs,” capital continues to flow into the index’s top holdings, since so many are in retirement plans. Because these stocks are highly liquid. For traders, they provide a “safe haven” to move large amounts of capital without creating a gap between buyers and sellers.
When capital inflows reverse from these top-10 holdings (and they will reverse), the illusion of a strong market will fade quickly. Most likely those flows will be into bonds or gold for safety as something has likely changed the bullish psychology of the market.
Just in case you are wondering, buyers are significantly lower in Apple (AAPL) currently.
While the top-10 holdings of the major indexes continue to be a “safe haven” for traders currently, heading into 2022, I would keep a close watch on them. They are likely going to be the best indication for when the flight to safety has started.
Of course, if you have been holding “meme” stocks this year, the “wipe-out” should already have you thinking about changing your investment strategy. Source Lance Roberts
The Week Ahead
The last full week before the holiday season begins features four central bank meetings and a barrage of economic releases. On Dec 15th the FOMC may reveal an accelerated tapering timeline and perhaps an updated dot plot, given that markets are already pricing in better than 50% odds of a rate hike by May 2022.
On Thursday, the ECB and Bank of England both have tough decisions to make, with the euro and pound under pressure and rate hawks turning cautious. More inflation figures drop with U.S. PPI on Tuesday, followed by CPI from the UK and Canada the next day. This week also brings the first look at manufacturing and services PMIs for December in the U.S. and Eurozone.
China’s monthly data dump will include annual figures for retail sales and industrial production. Other events of note include U.S. retail sales, regional manufacturing updates from New York and Philadelphia, and Australia’s employment account. The week closes with UK retail sales and Germany’s business sentiment information
This article is provided by Gene Witt of FourStar Wealth Advisors, LLC (“FourStar” or the “Firm”) for general informational purposes only. This information is not considered to be an offer to buy or sell any securities or investments. Investing involves the risk of loss and investors should be prepared to bear potential losses. Investments should only be made after thorough review with your investment advisor, considering all factors including personal goals, needs and risk tolerance. FourStar is a SEC registered investment adviser that maintains a principal place of business in the State of Illinois. The Firm may only transact business in those states in which it is notice filed or qualifies for a corresponding exemption from such requirements. For information about FourStar’s registration status and business operations, please consult the Firm’s Form ADV disclosure documents, the most recent versions of which are available on the SEC’s Investment Adviser Public Disclosure website at www.adviserinfo.sec.gov/
The Optimized Investor
