

Why Credit Spreads are so Narrow

Newsletter
Week Ending June 5th 2026
Market Recap
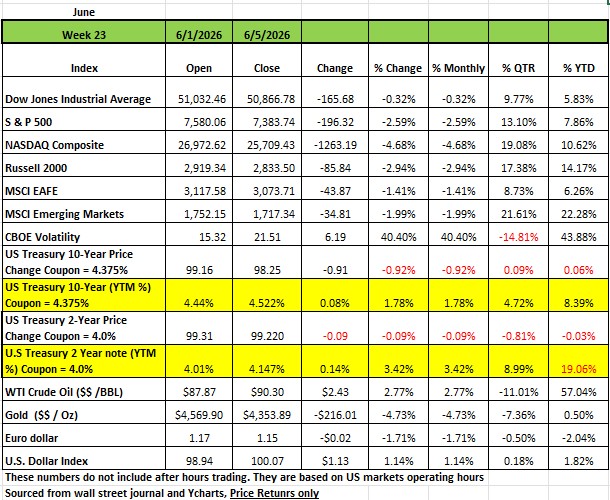
All four of the major indices declined last week with the largest drop posting on Friday. The largest decline was seen in the NASDAQ with a -4.68% decline followed by the Russell 2000 -2.94% The S&P 500 index fell -2.6% and the DOW dropped -0.32%. Much of the move seems to be attributed to 2 events as stronger-than-anticipated May payrolls boosted bets that the Federal Reserve will raise rates this year. The 2nd assumption was that Space X is going to become a publicly traded company this Friday and many pundits attributed to the sell off to investors raising cash for the IPO
The S&P 500 ended a 9-week winning streak, the market benchmark's longest run since 2023. The S&P 500 is now up +7.9% on the year. Russell 2000 has a YTD return of +14.17%, followed by the NASDAQ +10.62% and the DOW +5.83%
On Tuesday the S&P set new intraday record and closing highs over 7,600. However, the gains were erased later in the week after the Labor Department released its May employment data on Friday.
The jobs report showed non-farm payrolls rose by 172,000, well above the 88,000-increase expected in a survey. April and March payrolls also received upward revisions for a net upward revision of 93,000 jobs. The May unemployment rate remained at 4.3%, as expected.
This data led investors to assess the probability of a 25-basis-point increase in interest rates before the years end.
Treasury yields surged last week following Friday’s stronger-than-expected jobs report, which reinforced expectations that the Federal Reserve’s next move would be an interest rate hike. (remember when bond, price drop Yields rise) The largest increases were led by leisure & hospitality, health care & social assistance, construction, and government.
By Sector
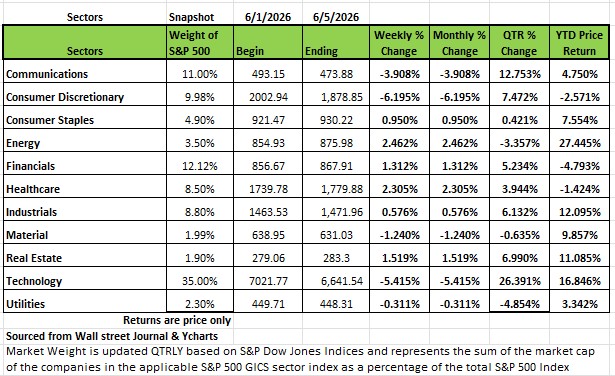
The consumer discretionary sector had the largest percentage drop of the week, falling 6.2%, followed by a 5.4% loss in technology and a 3.9% slide in communication services. Materials shed 1.2% while utilities edged lower.
Ford Motor (F) was hit hardest in consumer discretionary, losing 15%. The automaker reported its total US vehicle sales fell 13.6% year over year in May to 190,828 vehicles. Internal combustion vehicle sales fell 12.3% while hybrid and electric vehicle sales were down 15.7% and 43.9%, respectively, the company said.
Also weighing on consumer discretionary, Lululemon Athletica (LULU) shares fell 13%. The athletic apparel retailer forecast fiscal Q2 earnings per share and revenue below analysts' expectations despite its fiscal Q1 results slightly topped Street views. Lululemon Athletica also trimmed its 2026 guidance.
In the technology sector, Ciena (CIEN) had the largest percentage drop of the week, falling 16%. The drop came even as the networking systems and software company provided an upbeat fiscal third-quarter revenue outlook and its results topped market estimates.
Broadcom (AVGO) also weighed on the technology sector as its stock declined 14%. The chip designer reported fiscal second-quarter results above Wall Street's estimates as its artificial intelligence revenue more than doubled on the back of increased demand for custom accelerators and networking solutions. However, analysts at RBC Capital Markets and UBS said investors were disappointed that the company only reiterated its its 2027 artificial intelligence guidance rather than raising it.
On the upside, the energy sector rose 2.5%, followed by a 2.3% gain in health care, a 1.5% rise in real estate and a 1.3% increase in financials. Consumer staples and industrials also edged higher.
Marathon Petroleum (MPC) had the largest weekly percentage increase in the energy sector, climbing 5.3%. The company reported it swung to a larger-than-expected Q1 adjusted net profit from a year-earlier loss while revenue also topped expectations.
Next week, earnings are expected from companies including Oracle (ORCL) and Adobe (ADBE). This week Economic data will include the May consumer price index as well as the May producer price index.
Narrow Credit Spreads
Why Credit Spreads Are So Narrow – And What A Widening Could Signal
When purchasing a corporate bond, we all look for yield, Yields are calculated by the coupon on the bond, the price you pay for the bond after issue and the different between the current price and the redemption price (usually $1000). The taxation will vary; interest will be taxed as ordinary income. The difference between the purchase price and the redemption value will in most cases be either a long-term capital gain or loss. Typically, the more risk associated with a company’s ability to pay the Bonds redemption value the lower the price should be. So, the spread in yield between investment grade bonds (AAA-BBB) and lower grade bonds should be greater for taking on more risk. But that is not what we have been seeing lately.
Credit spreads across investment grade and high yield markets remain near the tightest levels of the post GFC era, despite the backdrop of persistent macroeconomic and political uncertainty. Investors are collecting decent all in yields, but very little incremental compensation for taking corporate risk over government bonds, which has important implications for forward returns and risk management.
Why Spreads Are So Tight Today
Resilient growth and low defaults. Global credit spreads have compressed in an environment of resilient economic activity, a soft landing outcome that now seems largely achieved, and still contained default rates, especially in higher quality credit. This macro backdrop justifies a lower risk premium than you would typically see late in a cycle with obvious stress in earnings and labor markets.
Healthy corporate balance sheets. Many issuers extended maturities and locked in low coupons earlier in the cycle, leaving them with solid interest coverage and manageable near term refinancing walls. Asset managers highlight that “companies are in good shape,” which is a key reason why spreads are tight rather than distressed.
“Carry is king” in a higher rate world. With policy rates still well above the zero rate regime of the 2010s, starting yields on IG (Investment Grade) and HY (High Yield) are attractive in absolute terms, even if spreads are thin. Commentary from large managers emphasizes that income, not spread compression, will dominate fixed income returns at current valuations.
Strong demand versus constrained net supply. Pensions, insurers, and income oriented investors have poured into corporate credit to lock in yield, while net new supply (especially in HY) has been moderate and often refinancing driven. In addition, competition from private credit has bid down spreads for larger borrowers that can toggle between syndicated loans, private debt, and public bonds, further compressing pricing.
Relative value versus sovereigns.
Sovereign fiscal profiles now often look weaker than many corporate balance sheets, with rising public debt loads and elevated policy uncertainty. In this context, it is easier to justify corporate spreads to Treasuries that are tighter than historical norms, as investors increasingly view corporate cash flows as more attractive than government credit risk.
The upshot is that spreads are tight, but not irrational. They are consistent with a market that assumes ongoing economic resilience, limited default risk, and persistent demand for income at a time when so called “risk free” assets come with their own fiscal and duration headwinds.
Why Tight Spreads Matter For Forward Returns
Asymmetric payoff profile. Research from large asset managers shows that when spreads are at or below their historical 10th percentile, the next several months tend to see modest net widening rather than continued tightening, especially in high yield. With spreads already near multi decade lows, the room for further compression is limited, while the potential widening in a risk off event is substantial.
Limited valuation cushion. Tight spreads mean there is very little valuation buffer if growth slows, earnings roll over, or default expectations shift higher. Even modest moves—a 30–50 bps widening in IG or a 100–200 bps move in HY—can be enough to erase a good chunk of a year’s coupon income.
Greater importance of security selection and structure. Several 2026 outlooks stress that in this environment, dispersion is rising and security selection matters more than broad beta, particularly across sectors and within the lower rated buckets.
For portfolio construction, that argues for treating credit primarily as a carry asset with limited capital gain potential, and for being deliberate about where you take spread risk rather than simply maximizing yield.
What A Widening Spread Often Signals
Credit spreads are one of the cleaner real time reads on the leverage and business cycle. Narrow spreads usually signal easy access to funding and risk on sentiment; sustained widening is typically the canary in the coal mine for deteriorating conditions.
Historical pattern. Research on past cycles shows that when growth slows and Treasury yields decline while credit spreads widen, equities typically struggle and recession risk rises. In every US recession, credit spreads have been meaningfully wider than they are today, even if the exact move has differed by cycle. Put simply, the way spreads widen—and the macro backdrop in which it happens—matters just as much as the absolute level.
For investors watching for an inflection point, the bond market remains the key early warning system. Credit and rates will usually flag a turn in the cycle before equities do, giving you valuable lead time to adjust risk, upgrade quality, and reallocate your portfolio accordingly.
The Week Ahead
With a global economy and markets still digesting the effects of elevated energy prices, the market will turn its attention to plenty of inflation-related economic data this week. Sunday evening, (early Monday in Japan), sees the release of the Japanese GDP price index and Tuesday evening sees the release of Japanese PPI along with Chinese CPI and PPI. The Japanese Yen had been under pressure due to their reliance on dollar denominated energy imports, with the Ministry of Finance directing the Bank of Japan to sell upwards of $73B to support the Yen. Currency markets will be on the lookout if intervention resumes as late Friday the USD/JPY moved firmly through the 160 level where the BOJ had been a seller. On Wednesday U.S. CPI is released followed by PPI on Thursday, numbers which not only dashed any expectations of rate cuts upon their release last month but firmly priced in expectations of hikes by year end. Friday offers a look at French and German CPI, while the inflation data culminates with the release of the University of Michigan Consumer Sentiment number along with Inflation Expectations. U.S. equity market resilience will be tested by whether the late week selloff in chip stocks merely offers a continued rotation into broader swaths of the market or if higher rates, energy prices, and a resumption of hostilities with Iran all becomes a little too much. Oh, and in case you missed there’s an IPO expected on Friday, yes Space X will be a public company but that’s about all we can say.