

The Rally That Refused to Wait VIX, Short Covering, and What This Market's Speed Says About Risk

Newsletter
Week Ending April 17th 2026
Market Recap
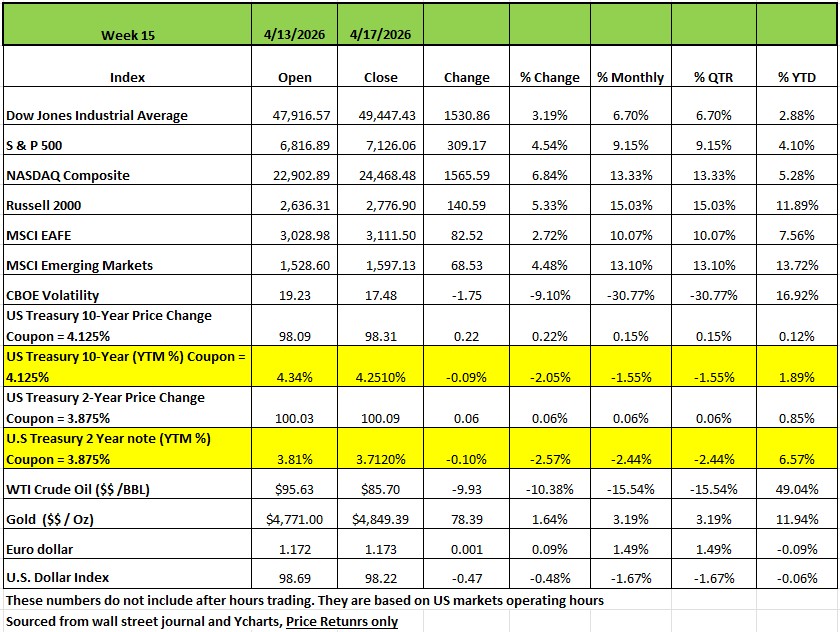
All four of the major indexes were up significantly last week with the NASDAQ posting the largest gain of +6.84% followed by the Russell 2000 +5.33%, the S&P 500 +4.654% and the DOW +3.19%, to a record close as investors grew more optimistic about the situation in the Middle East after Iran said the Strait of Hormuz was open. The President said Iran agreed to suspend its nuclear program indefinitely and won't receive any frozen funds from the US, as reported by Bloomberg. Trump said in a phone interview on Friday that a deal to end the war is mostly complete and talks over a lasting agreement will "probably" be held this weekend. However, earlier Friday, Iran announced the reopening of the Strait of Hormuz for the remainder of the US-Iran ceasefire period.
Treasury yields dropped moderately over the course of the week and oil dropped -13% as an apparent end to the conflict between the United States, along with Israel, and Iran came into focus. On Monday, President Trump said that officials in Iran reached out to his administration in pursuit of peace negotiations, causing Treasury yields to drop to start the week. This came despite the U.S. beginning a naval blockade of Iranian vessels in the Strait of Hormuz, effectively ending Iran’s ability to support their economy with shipments through the sea. Optimism regarding peace talks continued through the middle of the week, including President Trump saying in an interview that he believes the conflict is “close to over.” Though, on Thursday, investors began to worry that the U.S. blockade would cause fighting in the region to continue for some time, but President Trump stated that the prospect for a deal were “looking very good,” and that there was a 10-day ceasefire between Israel and Lebanon, that Israeli Prime Minister Netanyahu confirmed. This optimism turned into reality on Friday as Iran declared that the Strait of Hormuz was completely open for commercial traffic, along with President Trump saying that Iran had made key concessions regarding Iran’s enriched uranium stockpile. This caused Treasury yields to drop moderately again, while oil dropped 11% on Friday and ended the week down 13%. Meanwhile, the producer price index rose by just 0.5% in March, which was materially below consensus expectations of a 1.1% increase, despite increased energy costs due to the Iran conflict, easing investor concerns about inflation. The market implied probability of an increase or decrease to the Federal Funds Rate remained near 0% but the market implied end of year rate dropped from 3.57 to 3.49 over the course of the week.
By Sector
The technology sector had the largest percentage gain this week across the S&P 500's 11 sectors, jumping 8.1%, followed by a 6.6% climb in consumer discretionary and a 6.3% advance in communication services. Real estate and financials were also strong, rising more than 3% each, while industrials and health care also edged higher.
Oracle (ORCL) shares led the technology sector's advance, soaring 27%. The company said it plans to expand its multi-cloud networking capabilities to provide connectivity between Oracle Cloud Infrastructure and Amazon's (AMZN) Amazon Web Services.
The consumer discretionary sector was boosted by a 15% jump in Tesla (TSLA) shares. The electric vehicle maker is developing a new compact, lower-cost electric SUV as it looks to expand its lineup beyond the Tesla Model Y and Tesla Model 3, according to a Reuters report citing unnamed sources familiar with the matter. Also, Tesla is planning to launch a six-seat, long-wheelbase version of the Model Y in India as early as next week, Bloomberg reported, citing unnamed sources.
Four sectors declined this week, led by a 3.5% drop in energy and a 1.7% slip in utilities. Materials and consumer staples also edged lower.
The energy sector's drop came as crude oil futures fell amid Iran's announcement reopening the Strait of Hormuz. The hardest-hit stocks included shares of Coterra Energy (CTRA), Devon Energy (DVN) and APA Corp. (APA), which shed 7.5% each.
Quarterly earnings are expected next week from companies including Tesla, GE Aerospace (GE), GE Vernova (GEV), UnitedHealth Group (UNH), Philip Morris International (PM), International Business Machines (IBM), AT&T (T), Boeing (BA), Intel (INTC), American Express (AXP), Union Pacific (UNP), and Procter & Gamble (PG).
Economic data will include March retail sales and pending home sales as well as a final reading on April consumer sentiment
The Rally That Refused to Wait
VIX, Short Covering, and What This Market's Speed Says About Risk
The S&P 500 finished the week at a fresh record high of 7,022.95, capping its third consecutive weekly gain and a remarkable 10-out-of-11 positive sessions. The Nasdaq posted an 11-session win streak, and both indices have now fully erased the losses accumulated since the Iran conflict began on March 30th. The S&P 500 ended the week at 7,126.06, its highest closing level ever. It was only 21 days earlier that the S&P closed the week at 6368.85. This gives the S&P index an +11.89% gain in the last 3 weeks The recovery has been breathtaking in its speed — and that speed itself is worth examining closely.
The catalyst driving much of the optimism: President Trump stated that a peace deal with Iran is "very close," and Iran's announcement that the Strait of Hormuz is open to commercial traffic sent oil prices tumbling — a development that relieves significant inflationary pressure from an already strained consumer
The VIX Story: Eight Sessions from Fear to Calm
Let's talk about the VIX — the CBOE Volatility Index, often called the market's "fear gauge." It measures the market's expectation of 30-day volatility in the S&P 500, and it is one of the most telling instruments we have for reading investor psychology in real time.
When the Iran conflict escalated at the end of March, the VIX surged above 30. That level matters — it marks a threshold typically associated with acute fear, elevated hedging demand, and the kind of institutional repositioning that can cascade into forced selling. Readings above 30 are not routine. They signal that the market is genuinely pricing in the possibility of something going seriously wrong.
What happened next was extraordinary
The VIX moved from above 30 to below 20 in just eight trading sessions — one of the quickest such reversals in recent years. For context, during last year's Liberation Day sell-off, the same journey took 26 days. And the S&P 500 needed 88 sessions to return to a record high. This time around, the index reclaimed its record in just 53 sessions from the March 30 low.
The level below 20 matters too. Historically, a VIX reading under 20 signals that near-term risk perception has normalized — that the market is no longer pricing in an elevated probability of a sharp, near-term decline. When the VIX falls from above 30 to below 20, it is not merely reflecting improved sentiment. It is reflecting an active unwinding of protective positions, and that unwinding creates buying pressure.
That dynamic brings us to the real engine behind this rally.
Not all rallies are created equally. Some are driven by genuine fundamental improvements, earnings beats, falling interest rates, policy clarity. Others are driven primarily by the removal of pessimism. This rally has significant elements of both, but the speed of the move tells us that the latter played a dominant role, at least in the early stages.
Here is how short covering works in practice. When investors (Traders) become fearful — whether from geopolitical risk, recession concerns, or policy uncertainty — many establish short positions or buy put options as protection. This creates overhead supply: positions that will be unwound if conditions improve. When a catalyst arrives that reduces fear (a ceasefire, a positive earnings beat, a policy shift), those short positions must be covered. To cover a short, you buy the stock. Buying pressure drives prices higher. Higher prices force other short sellers to cover their positions. The cycle accelerates.
What we witnessed over the past several weeks is a textbook example. Institutional positioning data and commentary from Schwab and other market observers confirm the pattern: a key part of this rally has been bearish positions getting squeezed, with flows primarily targeting financials, discretionary, and technology stocks — precisely the sectors that had been laggards through much of March.
It is important to understand what this means and what it does not mean. A short-covering rally is not a fabrication or a market mirage. Prices are real. Gains are real. But a rally driven heavily by the removal of short positions is inherently front-loaded. Once the shorts are covered, the buying pressure from that source is exhausted. The market then needs fundamental buyers — investors willing to add to long positions based on the economic and earnings outlook — to sustain and extend the gains.
What This Market's Speed Tells Us About Risk
Speed is informative. The pace at which this market has recovered — faster than Liberation Day, faster than most historical comparisons — reflects several structural features of today's market environment that clients should understand.
Volatility Spikes Are Becoming Events to Fade, Not Trends to Follow
If you look at the pattern of VIX spikes over the past decade, a consistent feature has emerged: the duration of elevated volatility has been compressing. The 2008 financial crisis kept the VIX above 40 for months. The COVID crash of 2020 saw the VIX above 40 for several weeks. Liberation Day last year kept the VIX elevated for 26 trading sessions before normalized. This crisis: eight sessions.
Why? The market has become structurally faster at pricing in and processing risk. Algorithmic trading, options market liquidity, and the sheer size of the hedging and derivatives market mean that volatility is both amplified in the short run and mean-reverting more quickly than it once was. For the long-term investor, this argues strongly for staying invested through volatility events rather than repositioning based on fear at peak VIX levels.
The Recovery Masks Unresolved Fundamental Risk
Markets are forward-looking — sometimes aggressively so. The current rally is pricing in a near-term peace deal between the US and Iran, a soft landing on inflation, and continued strong earnings growth. All of those outcomes are possible. But it is worth noting what remains unresolved:
Inflation: The Cleveland Fed's nowcasting model points to further acceleration in April CPI. A TTM inflation rate of 3.58% gives the Federal Reserve no room to cut rates and could even force the committee's hand toward a hike.
The Fed Chair Transition: Kevin Warsh's confirmation hearing begins this week. If the market develops any concern that Fed independence is being compromised, or that a new chair will be pressured to cut rates prematurely into an inflationary environment, the bond market will react — and equities will follow.
Consumer Confidence: The University of Michigan Consumer Sentiment Index hit 47.6 in April's preliminary reading — the lowest on record. The consumer is telling us something different from what the equity market is pricing.
Guidance vs. Results: While 88% of S&P 500 companies reporting so far have beaten earnings estimates, 54% of those issuing forward guidance have issued negative guidance for the year ahead. That divergence — strong rear-view mirror, cautious windshield — is a signal worth monitoring.
Valuations Are Not Forgiving
The S&P 500's forward 12-month P/E ratio currently stands at approximately 20.9x — above the 5-year average of 19.9x and the 10-year average of 18.9x. At these valuations, the market requires continued earnings growth to justify current prices. Analysts are projecting 18% earnings growth for full-year 2026, which is an ambitious target. If macro headwinds from energy prices, sticky inflation, or a consumer spending slowdown materialize in Q2 results, the market will need to recalibrate — and the speed that helped it rally can work just as efficiently in the other direction.
What This Means for Your Portfolio
None of this is a call to sell or reduce risk. The trend remains up, earnings are solid, and the potential resolution of the Iran conflict would remove a significant source of inflationary pressure. Bull markets do not end simply because they rallied quickly.
But there are a few practical observations worth keeping in mind as we move into the heart of earnings season:
Stay disciplined on rebalancing. If equity gains have pushed your allocation above its target, this is a sensible environment to trim back to plan — not because the market is wrong, but because your personal risk parameters have not changed with the market.
Watch the signals, not just the prices. The 10-year Treasury yield has climbed back above 4.3%, and the dollar index has weakened. These are subtle shifts that suggest the bond market is not fully convinced the inflation story is resolved. When equities and bonds diverge in their economic read, it is worth paying attention to which is correct.
Mega-cap earnings will be the next real test. Tesla reports Wednesday, April 22nd, and several other trillion-dollar companies follow in the coming week. These results — and more importantly, their forward guidance — will tell us whether the market's optimism is justified or premature.
Do not chase volatility. The VIX below 20 tells you the market is calm today. It does not tell you the market will remain calm. A re-escalation in the Middle East, a hotter-than-expected CPI print, or a negative earnings surprise from a major technology company could shift the character of this market quickly. Having dry powder and a plan in place before volatility returns — not after — is the discipline that separates long-term wealth building from reactive portfolio management.