
Interest Rates, Labor, & Inflation,
Weekly review of the Market
for
April 29th 2024

The content of this Newsletter is to provide you with Economic insights to assist you in making better decisions with your investments. Unlike many other financial periodicals we will not mention specific companies, unless it is relevant to an overall economic issue. We welcome your questions on economic concerns and will address in our newsletter. just email us at info@optfinancialstrategies.com #FinancialAdvisor,#investmentmanagement #wealthmanagement #financialplanning #retirementplanning #401kplans
All four of the major indices were in the black last week after falling the week of 15th. Last week’s gain were led by the NASDAQ +4.23% followed by the Russell 2000 +2.79% the S&P +2.67% and the DOW+ 0.67%. Much of the upward movement was driven by the technology and consumer discretionary sectors amid better-than-expected earnings. However, the month of April has still proven to be a challenge as all of the indices have a negative return for the month ranging from -2.76% in the NASDAQ to -5.77% in the Russell 2000. YTD the markets are still in the black with gains ranging from +1.46% to +6.92%. Only the Russell 2000 in in the red for the year
Last week’s climb came with many companies reporting quarterly results above analysts' expectations. Among the 164 S&P 500 components that released quarterly reports last week, nearly 81% had better-than-expected earnings while 57% had better-than-expected revenue, according to Bloomberg data.
Treasury yields were up across the board last week with longer duration yields rising the most. Yields began the week lower as geopolitical tensions cooled following no major escalation in the Middle East over the weekend. However, yields jumped later in the week after a hotter-than-expected PCE report despite softer GDP growth. New home sales increased 8.8% in March, coming in stronger than expected, as sales rose in all major regions. The gain in March was the largest in over a year, even with the recent surge in mortgage rates. Durable goods also came in above expectations, rising 2.6% in March. The largest gain came from commercial aircrafts which jumped 30.6% for the month. Thursday’s GDP report came in well below the expected 2.5%, increasing at a 1.6% annual rate in Q1. The economy grew at the slowest pace in almost two years and came in well below forecasts from any economics group on Bloomberg. Friday’s PCE report (the Fed’s preferred measure of inflation) came in slightly above expectations as prices rose 0.3% in March and are up 2.7% from a year ago. Core prices, which exclude food and energy, also rose 0.3% in March and are up 2.8% versus a year ago.

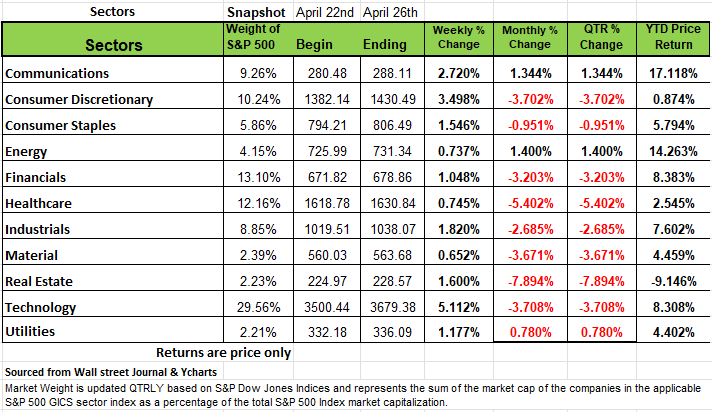
Sectors
All of the S&P 500's sectors rose this week, led by technology, which jumped +5.1%, and consumer discretionary, which climbed +3.5%. Other strong gainers included communication services, up +2.7%, and industrials, up +1.8%.
The technology sector's gainers included shares of Tyler Technologies (TYL), which rose +14% on the week as the provider of software and technology services for the public sector reported higher-than-expected Q1 results and forecast full-year earnings above analysts' mean estimates.
In consumer discretionary, shares of Hasbro (HAS) jumped +17% as the toy maker also posted better-than-expected Q1 results. The gainers in communication services were led by Alphabet's shares, which jumped 12% as the Google parent not only reported stronger-than-expected Q1 results but even unveiled its first-ever quarterly dividend alongside a $70 billion stock buyback program.
This week will see earnings reports from more heavyweight companies including Amazon.com (AMZN), Eli Lilly (LLY), Coca-Cola (KO), Advanced Micro Devices (AMD), McDonald's (MCD), Mastercard (MA), Qualcomm (QCOM0, Pfizer (PFE), Apple (AAPL), ConocoPhillips (COP) and Berkshire Hathaway (BRK.A, BRK.B).
Investors will be focused on Fed Chair Powell’s Press conference on Wednesday after the FOMC meeting . Many will be paying attention to his tone and if the Fed’s attitude will be more Hawkish than the last several meetings. In addition, April jobs numbers with monthly nonfarm payrolls and unemployment rates due on Friday. Other data expected next week include April consumer confidence, March construction spending and April auto sales.
Interest Rates, Labor, and Inflation
The economy was expected to grow at an annual rate of 206% in the first quarter and instead come in at 1.6%. A significant shortfall of 1%. It is also down significantly from the 3.1% rate in 2023, which was still benefiting from all the money infused in the pockets of consumers.
The markets barely reacted to the news, yes there was a bit of volatility on Thursday. The S&P had more than a 1% swing during the day but still ended the week up +2.67%
Last week’s GDP report did bring some angst brought on by the media and pundits voicing their opinions. Many worried that the economy was slowing too much too quickly sending fear that prompted the hard landing narrative again. While others saw inflation rearing its ugly head again, requiring more aggressive action from the Fed to squash it before it reaccelerates in again and gets out of control. While the declining trend in inflation appears to have stalled out for now, an examination of the numbers suggests that it will slowly reemerge in the months ahead. More importantly, with core PCE inflation at 2.8% year-over-year, it is still far below its 5.6% peak, set back in February of 2022, and it’s within one percentage point of the Fed’s 2% target.
We do not think the Fed will react to the inflation number at the meeting this week, However, the next time the Fed meets will be on June 11th and 12th at that meeting the April and May CPI numbers will be available and if both are high or show that inflation is reaccelerating, we could find the Fed changing course and raise interest rates again. If this happens there will be a high probably of stalling the economy, at least the housing portion of it which is very interest rate sensitive.
The narrative that the Markets and the Fed have been focused on is the unemployment rate U3. Currently it is at historic lows 3.6% for the month of March 2024, however there is another number that seems to be ignored and that is the U6 which was at 6.8% in March it was at 7.8% in February. The main difference between the U3 and U6 unemployment rates lies in the groups of workers included in each measure:
U3 is the official unemployment rate. It only counts people who are unemployed and actively looking for work as part of the labor force. U6 is a broader measure that includes not only the officially unemployed (U3), but also discouraged workers who have stopped looking for work because they cannot find job that fit their specific skill or salary needs. It also includes marginally attached workers who want a job but have not actively looked for the past four weeks, and part-time workers who want full-time work but cannot get it due to economic reasons.
So, while U3 only captures the officially unemployed actively seeking work, U6 aims to quantify the total underutilized labor force by including discouraged, marginally attached, and underemployed part-time workers. This makes the U6 rate consistently higher than the official U3 rate. From an economic perspective this group is with limited or no income and has less ability to help influence the economy. So what is the big impact here? Having the money to pay for obligations such as rent, food, insurance as well as to really contribute to the overall economy. Perhaps this is one contributor to the drop in GDP.
This Friday’s April jobs report should give us some further insight on the supply side. The not so strong GDP data from this past quarter could go either way in payroll employment. The markets are looking for a roughly 240,000 job gain following a greater than 300,000 increase in March, however, keep in mind that much of the March number could be related to part time. Moreover, with unemployment claims remaining at very low levels, the U.S. unemployment rate could remain at 3.8% - the 29th consecutive month with unemployment (U3) at or below 4%.
Since the unemployment rate dipped below 4.0% in December 2021, the U.S. economy has added a remarkable 8.4 million jobs, despite projections of very sluggish growth in the working age population. This has been achieved partly due to a rise in the labor force participation rate for people of working age and partly because of a migration surge. The increase in labor force participation rate is likely to fade from here. However, the lagged effect of the migration surge should continue to supply workers to meet still-rising demand. This could keep the unemployment rate from drifting significantly lower.
In addition, there is still little sign of a surge in wage pressures. Many expect the employment cost index, due out on Tuesday, to show a further small decline in year-over-year compensation growth, possibly to below 4%. Meanwhile, Friday’s reading on average hourly earnings for all workers in April could also show a slight drift down in wage inflation.
Despite a labor market that is universally acknowledged to be tight, workers are generally not receiving huge nominal wage increases. This may, to some extent, just reflect a greater determination on the part of business to limit wage increases than on the part of workers to demand them. It is notable that there have only been four major strikes so far this year, that is strikes involving more than 1,000 workers, and only one which has lasted more than a few days. The number of workers quitting each month has also now fallen below pre-pandemic levels, with a new reading on this statistic due out in the JOLTs report on Tuesday.
So, while the strength of the labor market could, in theory, ignite wage inflation, so far it has not done so in a serious way.
The U.S. economy is solid we still have strong job gains, low U3 unemployment and moderate wage gains. However, inflation is still sticky and while it is far below its peak levels, it has started reversing in recent months.
In particular, the personal consumption deflator rose by 2.7% year-over-year in March – its fastest pace since last October. The core consumption deflator, which excludes food and energy, rose 2.8% year-over year, the same as in February and not significantly lower than 2.9% year-over-year gains seen in January and December.
There are some areas of genuinely sticky inflation within services, most notably in measures of rent and owners’ equivalent rent, insurance, restaurants, leisure and hospitality and day care. Some believe that the rental inflation measures will continue to fade, perhaps with new construction of multi units housing but remember how many landlords got stiffed by tenants during the pandemic and with a shortage they may just take what the can and be more selective to renting to more responsible tenants. Auto insurance inflation should also fade. Meanwhile, an influx of migrant labor should eventually reduce inflation in the restaurant, leisure and hospitality and day care industries.
The alarms have not been sounded just yet but keep in mind that the younger consumer is more concerned about getting what they want when they want it and while credit card debt is at all time highs until credit lines are frozen, we could still see inflation rear its ugly head in the coming months.
Source David Kelly JPMorgan
A Technical Perspective
Earnings Season Shakes Up Technology
Thursday was an interesting trading day. Meta reported earnings Wednesday after the market close. On Thursday, it saw its share price decline as much as -16% during the day’s trading session. This negatively impacted several other large technology stocks, but these stocks rallied into the close on Thursday. The table below shows the Magnificent 7 stock percentage declines to their Thursday lows and compares those declines to where they finished the trading Thursday.
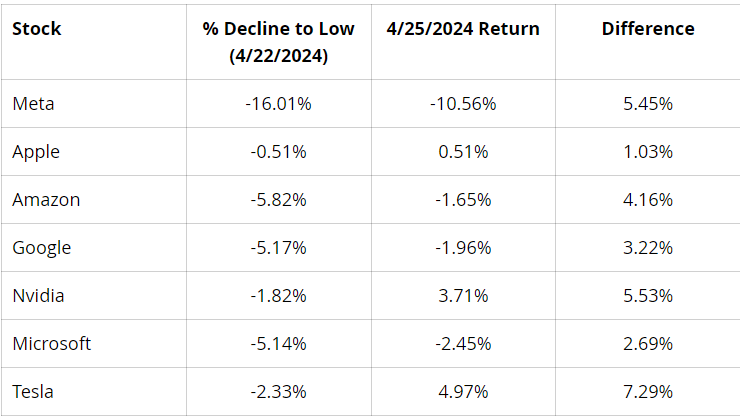
While each of the large technology names declined substantially during the trading day, they all rallied into the close. On Friday, after Google reported earnings, its rose by +9.9%. Amazon was up more than +3% and Nvidia was up 6%. Volatility occurs in both directions. It’s clear that large technology stocks are showing signs of emotion.
With technology stocks becoming increasingly volatile, they have slipped in sector rank. According to Canterbury’s proprietary research, Financials, Industrials, and Energy are the top ranked sectors. This is on a risk-adjusted basis, where each sector’s relative strength is adjusted for its volatility. Here are the current sector rankings:
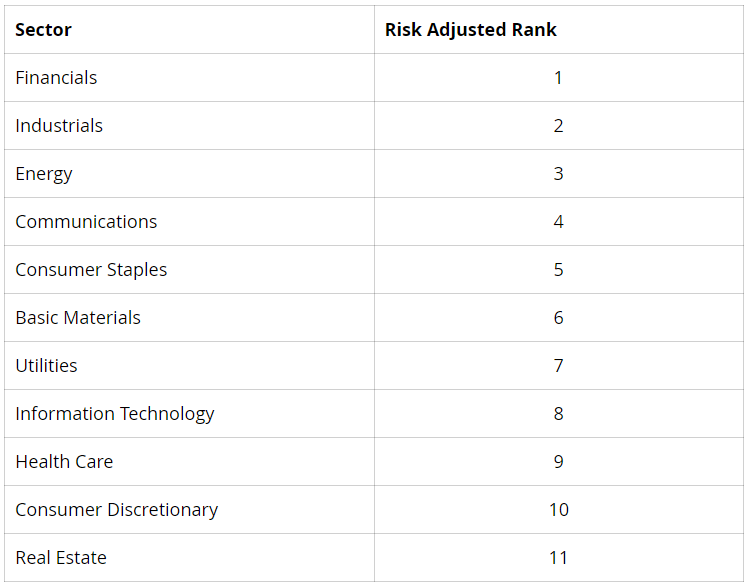
As you can see in the table, Information Technology, which is the largest sector in the S&P 500 by a considerable margin, currently ranks 8th on a risk-adjusted basis. This is primarily due to the weakness of Apple stock in 2024. Additionally, Consumer Discretionary is ranked second-to-last. This sector contains Tesla, which has been one of the worst performing S&P 500 stocks year-to-date. To begin last week, it was down as much as -40% YTD. Remember, volatility goes in both directions. On Monday (April 29th), Tesla was up as much as +18% during the trading day. That is not a rational swing.
According to the AAII Investor Sentiment Survey, there are now a larger number of “bearish” individual investors than “bullish” ones. The latest survey, published Thursday of each week, showed that 32.1% of investors surveyed considered themselves bullish on the markets; 33.9% were neutral; and 33.9% were bearish. A month ago, 50% of investors surveyed were bullish. This marks the first time there have been a larger number of bearish investors than bullish ones since November of last year. The quick shift in sentiment shows just how emotional investors are in decisions related to markets.
Chart of the Week: T-Mobile (TMUS)
This week’s Chart of the Week is T-Mobile. Since the beginning of this year, the stock has “been in a crouch.” The question is, is the stock now ready to pounce? The stock chart and corresponding points are below.
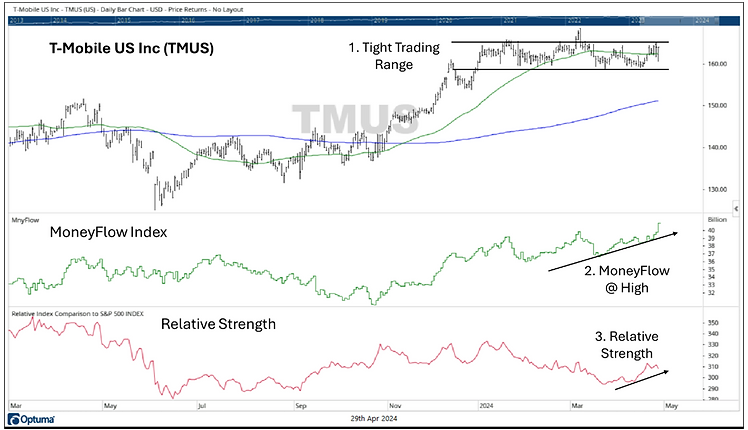
YTD, TMUS has been in a tight trading range. The difference between the year’s price high and low is only about 5%. The stock has moved sideways and is getting into a “crouch,” positioning itself to move either up or down.
- MoneyFlow index is a volume indicator that measures “smart money.” MoneyFlow is at a new high, while the stock has moved sideways. This is a positive divergence.
- While the market has been shakier lately, T-Mobile’s relative strength has begun to increase. Increasing relative strength is a positive characteristic.
- While T-Mobile has trended sideways over the last 4 months, it has had some positive technical developments, such as rising MoneyFlow and rising relative strength. The stock is now in a crouch. It’s only a matter of time before it makes a move, one way or another.
- We continue to monitor for changes in volatility, particularly in the area of technology-related stocks. Technology-related sectors have fallen in ranking, and some stocks are showing signs of weakening. Given tech’s weighting in the markets, whichever way technology moves, the market will tend to follow. Source Brandon Bischoff.(Canterbury Investments)
The Week Ahead
With U.S. inflation rates remaining stubbornly above the Fed’s long-run estimates, a significant labor market downturn may be necessary for any chance of a rate cut this year. U.S. employment and wage figures will be released this week, culminating in Friday’s monthly non-farm payrolls report. Job gains for April are estimated at a still-robust 250k, and any upside surprises in wage growth may push the 10-year Treasury yield closer to the 5% level last seen in October. When the FOMC meets this week and releases its policy statement Wednesday, Fed Chair Powell may be forced to strike a more hawkish tone given the recent inflation data. Meanwhile, the last busy week of earnings releases arrives and includes technology heavyweights Apple, Amazon, Advanced Micro Devices, Super Micro Computer, Qualcomm, and many more. The rest of the U.S. economic calendar features ISM PMI survey results, consumer confidence, preliminary Q1 productivity figures, and factory orders. On the international side, later tonight China announces the official government services and manufacturing PMI for April. If the Chinese economy can build on the prior month’s momentum, it may provide an additional boost for oil prices. In Europe, the main events will be CPI and GDP flash estimates from Germany and the Eurozone. A rate cut is widely expected in June, but an uncertain path beyond that means these readings may significantly impact the European Central Bank’s thinking. Finally, in Japan, traders will be watching the tumbling yen—its steep decline may force the central bank to intervene. Minutes from the recent BOJ meeting will be released Wednesday evening.
This article is provided by Gene Witt of FourStar Wealth Advisors, LLC (“FourStar” or the “Firm”) for general informational purposes only. This information is not considered to be an offer to buy or sell any securities or investments. Investing involves the risk of loss and investors should be prepared to bear potential losses. Investments should only be made after thorough review with your investment advisor, considering all factors including personal goals, needs and risk tolerance. FourStar is a SEC registered investment adviser that maintains a principal place of business in the State of Illinois. The Firm may only transact business in those states in which it is notice filed or qualifies for a corresponding exemption from such requirements. For information about FourStar’s registration status and business operations, please consult the Firm’s Form ADV disclosure documents, the most recent versions of which are available on the SEC’s Investment Adviser Public Disclosure website at www.adviserinfo.sec.gov/
The Optimized Investor
