

Weekly Market Update ending 9/19/2025
Newsletter
September 22, 2025
It’s been a while since we last posted our market update newsletter. A lot has happened in the last several months. First and foremost, we establish our own Registered Investment Advisory Firm: Optimized Capital. Our goal is the same: to create customized personal portfolios for each individual to help them meet specific goals and objectives.
We are a service-oriented firm and believe that you deserve the level of attention and communication that you need with respect to all financial issues in your life, especially during times of uncertainty. As advisors, we are here to help, to work with you when it comes to making significant financial decisions.
On to the markets
The start of 2025 has been a bit crazy; we had a transition from one administration to another with a political philosophy that is 180 degrees different from the previous administration. The current administration is off to an aggressive start to address the issues created by years of irresponsible politicians on both sides of the aisle. Our debt has gotten out of hand, and there are not many on either side of the aisle that are disagree with the problem. But somehow, we have created a culture where it is ok to be fiscally irresponsible. At some point in time, hopefully not in the near future, Americans will have to deal with the consequences of irresponsible government spending.
Last week
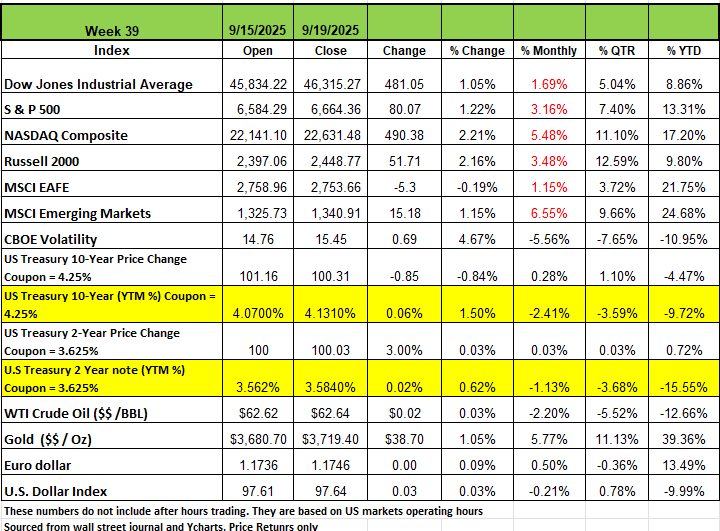
The S&P 500 index rose +1.2% this week to a record close of 6664.36, as did the DJIA + 1.05% closing at 46,315.27, and the NASDAQ, up 2.21% at 22,631.48 all after the Federal Reserve cut interest rates by 25 bps
The Federal Reserve's Federal Open Market Committee on Wednesday reduced its benchmark lending rate by 25 basis points, noting increased downside risks to employment and signalling further policy easing later in 2025. This lowered interest rates to a range of 4% to 4.25%.
While this was in line with Wall Street's expectations, it sparked a relief rally as it marked the first rate cut since December and followed a weaker-than-expected August payrolls report.
Treasury yields ended the week mixed, with shorter maturities moving lower while intermediate- and longer-term yields edged higher. Investors reacted to a combination of factors, including inflation concerns, a distressed labor market, and the Fed’s 25-basis-point rate cut. Despite signs of a cooling labor market, U.S. consumers kept spending at a healthy pace in August, with retail sales rising 0.6% and surpassing consensus expectations of 0.2%. Industrial production outperformed expectations in August, edging up 0.1% as most major categories posted gains, though downward revisions to prior months tempered the overall picture. New home construction capped off a weak summer with an 8.5% decline in August, falling to its lowest level since May amid a challenging environment for developers. The pullback spanned both single-family and multi-family units, with single-family starts down 11.7% over the past year while multi-unit starts have climbed 8.9%.
Weekly jobless claims came in at 231k last week, below the consensus expected 240k and reversing the prior week’s jump. However, while layoffs remain relatively low, hiring activity has nearly stalled, indicating a softer labor market with reduced demand for and supply of workers. Gold continues its upward mobility, closing at $3719.40 /oz.
Sectors
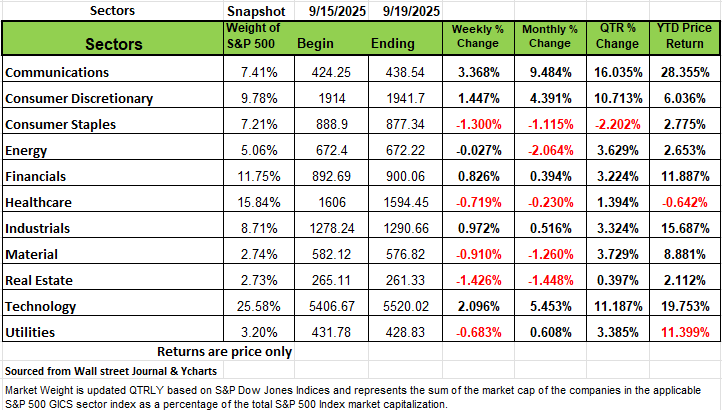
Six of the 11 sectors saw a positive return on the week with Communication services posting the largest percentage increase of the week, up +3.4%, followed by a +2.1% climb in technology and a nearly +1.5% gain in consumer discretionary. Industrials and financials also edged higher.
Google parent Alphabet (GOOGL) had the strongest weekly gain in communication services, rising 5.8%. Google and PayPal (PYPL) announced a multiyear partnership to explore a range of digital commerce solutions. Also, according to a Bloomberg report citing people familiar with the matter, Google will meet the European Union's November deadline to propose changes to its advertising technology business following a $3.5 billion fine, but won't provide a full breakup that was previously requested by the EU and company rivals.
In the technology sector, Intel (INTC) shares soared 23% as Nvidia (NVDA) said it will invest $5 billion in Intel stock at $23.28 per share, as part of a collaboration to develop custom data center and personal computing products.
On the downside, real estate fell 1.4%, consumer staples shed 1.3% and materials declined 0.9%. Health care, utilities and energy also edged lower.
Decliners in real estate included Extra Space Storage (EXR), down -5.3%, and Public Storage (PSA), down -4.6%.
Next week, earnings are expected from companies including Micron Technology (MU), Costco Wholesale (COST) and Accenture (ACN).
Economic data will include the third estimate of Q2 gross domestic product. Also, August new home sales, existing home sales and durable goods orders are expected, as well as the August personal consumption expenditures price index.
How Much Further Can the Market Go
Back in December 1996, then–Federal Reserve Chair Alan Greenspan Coin the term “irrational exuberance” when he posed the question “How do we know when irrational exuberance has unduly escalated asset values, which then become subject to unexpected and prolonged contractions…?”
This question still echoes through financial markets today: Back then, Greenspan’s words seemed premature. Stocks climbed for years before the dot-com bubble burst. But when that reversal came, it wiped out trillions in paper wealth and altered the market’s course for a decade. Just as a reference those that invested in the NASDAQ broad-based Index in 1999 did not get back to breakeven until 2016. This is a long time to wait for most Americans
Fast-forward to today. The forces at work are larger, faster, and more interconnected than ever. Record household exposure to equities, extreme leverage, stretched valuations, and a culture of speculative trading have created an environment where even small shocks could have outsized consequences.
The stock market is currently experiencing a historic growth period, with major indexes like the S&P 500, Dow Jones Industrial Average, and Nasdaq Composite all reaching all-time highs. Since January of 2020 the DOW has increased by 60%, the S&P 500 by 104%, the NASDAQ by 148.7%, and the Russell 2000 by 47.4%. These numbers include the negative -22% in 2022. Take into consideration that prior to 2020 the average annual return has been high single digits.
This recent growth can be attributed to a few factors: One factor is that the U.S. government has deployed over $5 trillion into the economy during the pandemic and while it also stimulated inflation it also drove spending. High Frequency Trading (HFT) as well as new companies like Robinhood and higher contributions from 401K plans have added to the inflow of dollars into the market. Despite a softening labor market and stubborn inflation, consumer spending and corporate earnings have remained strong. This has provided a solid foundation for the market's accent. In addition, there is an over optimistic outlook on interest rate cuts by the Federal Reserve and excitement over artificial intelligence (AI), has contributed to a level of euphoria among investors.
However, with such a significant and sustained uptrend, many season investors have concerns about a potential correction on the horizon. The current environment has an eerie similarity to the dotcom days and the 2008 financial crisis, when many Americans just felt “This time was different”
Aa a reminder, a market correction is typically defined as a drop of 10% or more from a recent high. It's a natural and common part of the market cycle, often seen as a "healthy" recalibration that brings stock prices more in line with their underlying value after a period of rapid growth. While corrections are a normal occurrence, their potential for a deeper, more prolonged downturn—a bear market—is what often fuels investor anxiety.
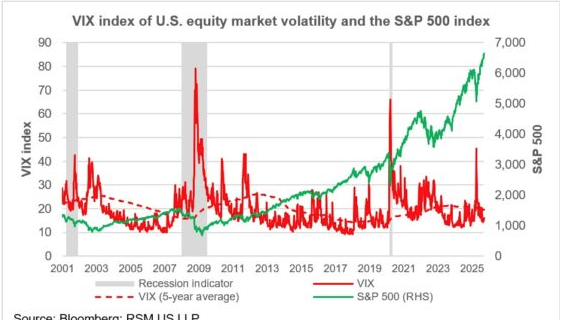
The equity market’s enthusiasm for all things related to artificial intelligence seems to have overwhelmed concerns among investors over the loss of U.S. productive capacity and the imposition of tariffs.
After selling off during the initial tariff shock, April 7th, the S&P 500 and NASDAQ indices are now setting records even as S&P 500 volatility falls below its long-term average.
The exuberance has even spilled over to the more traditional Dow Jones Industrial Average and the Russell 2000 small-cap index, both of which have more than recovered their losses.
Is this a bubble in the making?
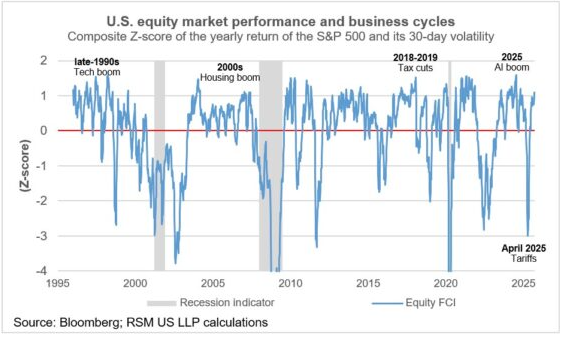
To answer this question, we look at our composite equity market performance index, which is based on the level of S&P 500 returns and its volatility.
Last week, this index moved one standard deviation above levels of risk that would normally be expected.
In the past four business cycles, a move above one standard deviation has preceded equity market corrections. Even though the correction might have been short-lived, as occurred in April, the recent runup in equity valuations is a red flag that a correction could be in the making.
The Risk of a Correction
While the market's upward trajectory has been remarkable, several factors are raising red flags for a potential correction:
Market Overvaluation: Critics argue that current stock prices have become disconnected from fundamental economic realities. The sheer speed and magnitude of the rally, especially in the AI sector, may have created a "bubble" where prices are inflated by speculation rather than sustainable earnings growth.
Fed Policy Uncertainty: The market has priced in a significant number of future rate cuts. If the Fed, wary of reigniting inflation, decides not to cut rates as aggressively as expected, it could disappoint investors and trigger a sell-off.
Geopolitical and Trade Tensions: New tariffs and ongoing trade disputes have injected a degree of uncertainty into global supply chains. This can squeeze corporate margins and negatively impact investor sentiment.
Liquidity Stress: Some analysts are concerned about potential liquidity stress as the Fed continues to reduce its balance sheet (quantitative tightening) while the government issues a large amount of new debt. This could put upward pressure on yields and create a headwind for stocks.
Historically, corrections are quite common. Since 1986, the S&P 500 has experienced a correction of 10% or more approximately every two to three years on average. These downturns can be sharp and short-lived, or they can be the precursor to a more severe bear market. The dot-com bust and the 2008 financial crisis are two major examples of how corrections can spiral into deeper crises.
While the current market environment is exciting, the risk of a correction is real. Investors must have a diversified portfolio that can weather potential volatility and avoid making emotional decisions based on short-term market movements. A correction doesn't signal the end of the world; it's a normal part of the investment landscape and, for some, can even present a buying opportunity. But for older Americans who are either close to or already in retirement, a correction could necessitate a lifestyle adjustment.
Lastly, according to Economist Joseph Carson, equity prices are rising due to anticipated future profits, and companies' tax payments to the US Treasury—a reliable measure of corporate profitability- are much lower than they were a year ago. I anticipated that the corporate tax payment on September 16 to add several billion to the monthly tally, but it added less than $2 billion.
As a result, by mid-September, corporations have made quarter-end tax payments totalling $55 billion, compared to $102 billion for September 2024. The "Big Beautiful Bill" primarily extended many corporate tax provisions that were set to expire at the year's end, so the reduction in tax payments doesn't appear to be due to tax changes. Instead, it reflects a significantly lower level of corporate profitability.
The Week Ahead
The U.S. dollar rallied late last week, and volatility was mostly subdued, boosted by the Fed’s optimistic economic outlook and a muddled interest rate forecast beyond this year. Whether or not those trends continue could be influenced by several events on this week’s calendar. First, there are a plethora of appearances by FOMC members to be scrutinized. Secondly, Friday’s PCE price index release is expected to show that inflation pressures are continuing to rise, albeit modestly. And third, flash PMI readings in the U.S. and elsewhere will provide a sense of how the manufacturing and services sectors are holding up as the end of the third quarter approaches.
Other releases on the U.S. calendar include new and existing home sales, the final estimate of Q2 GDP, durable goods orders, and the goods trade balance for last month. Micron Technology reports earnings on Tuesday, followed by Costco on Thursday. On the international side, Japan’s inflation updates and minutes from last week’s BOJ meeting are the notable releases, along with the previously mentioned flash PMI readings. Investors will continue to monitor U.S.-China trade negotiations and progress on the government funding bill that passed the U.S. House on Friday but faces an uphill battle in the Senate with the September 30 deadline looming.