
A Bull Market review
for April 8th 2024

The content of this Newsletter is to provide you with Economic insights to assist you in making better decisions with your investments. Unlike many other financial periodicals we will not mention specific companies, unless it is relevant to an overall economic issue. We welcome your questions on economic concerns and will address in our newsletter. just email us at info@optfinancialstrategies.com #FinancialAdvisor,#investmentmanagement #wealthmanagement #financialplanning #retirementplanning #401kplans
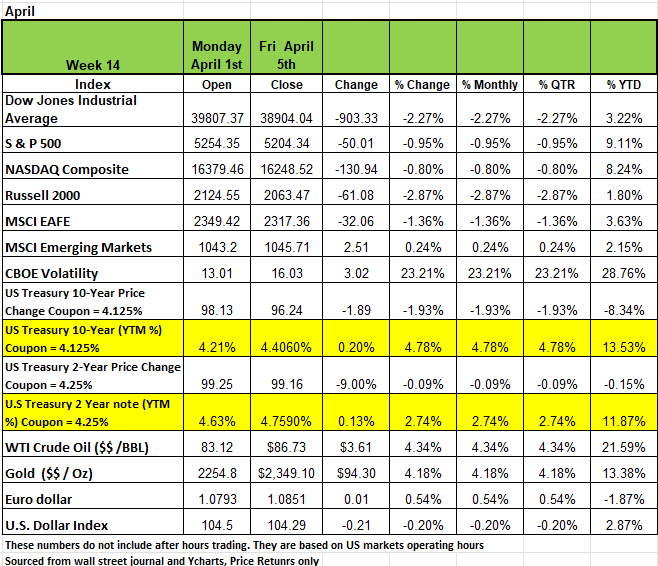
The markets were a bit shaky last week but still ended the week with minimal damage. The largest declines were seen in the Russell 2000 and the DOW declining -2.87% and -2.27% respectively. The S&P 500 and the NASDAQ fell less than -1% with a -0.95% and -0.80% respectively to start the 2nd quarter of 2024. Much of the decline came as Federal Reserve officials indicated they were in no rush to cut interest rates giving the markets a reality check on the number of possible rate cuts in 2024.
Health care and real estate posted the steepest weekly declines among sectors, while only energy and communication services closed higher.
While Fed Chair Powell said that most policymakers believe it will be appropriate to start reducing interest rates at some point in 2024, Several other Fed officials raised concerns of any cuts if inflation was not tamed.
Last month, the central bank's Federal Open Market Committee kept its benchmark lending rate unchanged, its fifth straight month, and maintained expectations for three cuts this year. The FOMC started tightening monetary policy in March 2022 to tame inflation, which has started to creep back up in the first 2 months of 2024.
About 97% of traders are expecting the committee to leave its target rate unchanged at 5.25%-5.5% at its two-day meeting on April 30 and May 1, according to the CME FedWatch Tool.
Another piece of market concerns was Nonfarm payrolls, which climbed by 303,000 last month, exceeding the Street's views for a 214,000 gain, according to the US Labor Department report on Friday.
Keep in mind that earlier numbers from January were revised down so there are expectations that the high number of jobs will be adjusted. In addition, US manufacturing activity expanded in March, while the services sector continued to grow, though at a slower sequential pace, data from the Institute for Supply Management showed.
Treasury yields rose last week on strong economic data suggesting interest rates may be higher for longer. The unemployment rate fell from 3.9% to 3.8%. Treasury yields rose after the report as the market lowered its expectations that the Fed will cut rates at its June meeting. Earlier last week, Fed Chairman Jerome Powell said he still expects that the Fed will likely cut interest rates this year but reiterated it will wait until it has more confidence that inflation is moving towards its 2% target. Powell also noted that the supply and demand for labor have become more balanced, or less tight, which could alleviate inflation pressure. Friday’s jobs report also showed the labor force participation rate rose to 62.7%, which beat expectations and has been steadily rising back to pre-COVID levels.
Sectors
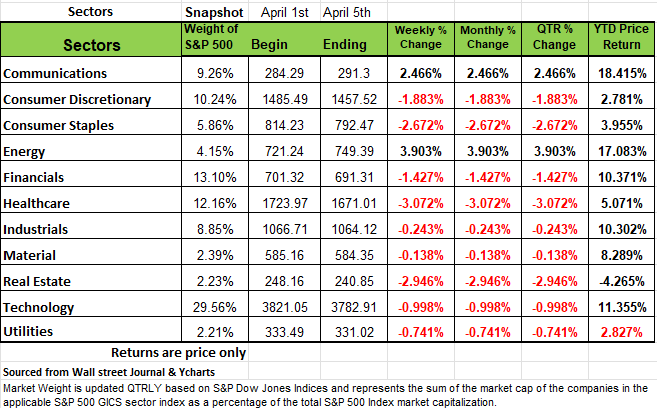
Nine of the 11 sectors were in the red last week. among the declines, health care slid -3.1% amid outsized declines in shares of Humana (HUM), CVS Health (CVS) and UnitedHealth Group (UNH) after the Centers for Medicare and Medicaid Services said the government would increase payments to Medicare Advantage plans by +3.7% on average year over year. This is a concern since medical care is rising at a fast pace.
Johnson & Johnson (JNJ) agreed to acquire Shockwave Medical (SWAV) in an all-cash deal with an enterprise value of $13.1 billion.
Real estate slipped -2.9% for the week, while consumer staples lost 2.7% as a 25% plunge in Lamb Weston's (LW) shares more than countered a 4.9% gain in Conagra Brands (CAG). Lamb Weston logged weaker-than-expected fiscal Q3 results and lowered its full-year outlook. Conagra's fiscal Q3 results topped the Street's estimates as volume trends improved.
Consumer discretionary was down -1.9%, led by a 15% slump in Ulta Beauty (ULTA) shares after the beauty retailer's management offered downbeat views on the beauty category.
Financials dropped -1.4%, while technology shed 1%, weighed down by a 12% decline in Intel (INTC) shares after the chipmaker restated operating losses for its foundry business, as it reorganizes its financial reporting structure to save costs and provide greater transparency.
Utilities fell -0.7% for the week, and industrials lost 0.2%, despite a 12% jump in General Electric (GE) shares after the industrial conglomerate completed the separation of its renewable energy business, GE Vernova (GEV). Materials was down 0.1% for the week.
Energy jumped 3.9%. Schlumberger (SLB) agreed to buy oilfield technology solutions provider ChampionX (CHX) in an all-stock deal.
Communication services rose +2.5%, led in part by a 1.7% gain in Paramount Global (PARA) shares. The company was reportedly in discussions about entering into exclusive talks over being acquired by media company Skydance. Paramount would continue to trade publicly under the Skydance Media offer, CNBC reported.
Separately, Endeavor Group (EDR) agreed to be taken private by private equity firm Silver Lake in a $13 billion buyout deal.
Next week's economic calendar will feature the key official consumer and producer inflation reports for March, and an initial reading of consumer sentiment for this month. Minutes of the FOMC's March meeting are scheduled to be released Wednesday.
The U.S. Market
Sometimes a bull market is a bull market.
At the beginning of 2023 the S&P 500 index was at a level of 3854.97. It peaked on July 25th at 4567.46 giving investors an 18.348% return in the first 7 months of 2023. By Oct 27 the S&P 500 index was at 4103.78, a decline of -9.85% from the July high. Then the markets reverse After Fed Powells October press conference by year end then index posted a 18.85% increase form the Oct low and ended the year with a +23.72 gain. 2024 continued to post extraordinary gains with a 9.63% gain as of Fridays close. Since the Oct 27 low the markets have hit new highs passing the 5000 level in mid-February and returning +26.35% in a little more than 23 weeks. This by all definitions is a bull Market. Investors are exuberant.
The narrative for interest rate cuts in October of 2023 was that the Fed would make 6 reductions in 2024, much of the movement since then was based on these 6 rate cuts. Earnings for 2023 were better than expected, even though data started coming in and inflation for both January and February were higher than expected, Markets shifted to expecting 3 rates cuts in 2024 and continued on its Bull path.
Though equities have been choppier in recent weeks, given a package of robust economic data coming on the heels of a nearly uninterrupted four-month advance, there appears little justification, now to interrupt the current bull market.
Price leadership has broadened throughout the market, which is positive, this meaning more companies are performing well instead of just a handful. The Powell has still signaled the Fed’s intent to cut policy rates this year, even though other Fed Presidents have voiced their concerns that they are concerned that inflation may be reignited, and no cuts may be in order. However, this can all change on a dime. If Wednesday’s CPI numbers for the month of March are in line the Markets will react positively, if CPI comes in hot the markets will react negatively. The markets are still betting on three cuts beginning at the June meeting, this will continue to change as more incoming data is digested, however, keep in mind that rate cuts may not always be the welcome news they seem.
Rates cuts generally come in response to weakness in the economy or to a negative shock like the pandemic or 2008. Here is a bit of historical data. Since 1974, the S&P 500 has averaged a decline of -23% in the first 200 days following the first cut of the rate cycle. Not exactly the result you would expect. When the Fed is in a “on hold” pattern as it is now it has historically been accompanied by stronger share prices, (the economy is digesting the prevailing policy of day and continuing to expand).
The longest pause prior to the current environment was 446 days which also experienced a +22% move in the S&P 500 this occurred just prior to the Global Financial Crisis in 2008. Which also blindsided most investors. If we have learned anything from history is that over confidence usually results in bad outcomes, whether it’s the housing market, crypto currency, or stock prices when values skyrocket in short periods of time, there is usually a significant correction.
We are not suggesting that you throw in the towel but there is enough mixed information to keep us focused on a shift. Aggregate Index earnings have been flat for nearly two years. Granted there have been some positive outliers (specifically A.I. and adjacent Tech and some larger banks) we continue to harbor some concern over the discrepancy between expectations for corporate profits on the long-end of the earnings curve (+9, +12, +15 months) and the lukewarm growth rate of actual earnings. At ~13 pct. points, the Next Twelve Month -Trailing Twelve Month spread of sub-industry positive-to-negative earnings growth sits near its widest divergence in 20+ years. The markets don’t seem to be overly concerned with current valuation levels as inflows continue to move valuations to new and higher levels. We admit we have been overly cautious over the last few years and may have minimized growth on the side of caution. We have never had a situation in which the government injected large sums of money into the economy in such a short time frame, we created an environment where able working individuals could earn more by sitting at home than by going to work. We increased Federal debt to all-time highs relative to GDP, keeping in mind that a good portion of the current growth rate is "fueled by large amounts of government deficit spending and past stimulus. This is not healthy long term.
Lastly the conflicts in Ukraine, and the Middle East as well as the frictions in China and the outcome of our Presidential election will eventually have an impact on markets. These significant and somewhat unprecedented forces cause us to remain cautious.
With that in mind, and the broader economy performing well, the markets "seem to be pricing in at a 70% to 80% chance of a soft landing, we are not so confident the probability is that high. Economically, the worst-case scenario would be stagflation, which would not only come with higher interest rates but also with higher credit losses, lower business volumes and more difficult markets,
Long term we maintain a generally bullish attitude and history has shown that that markets can – and often do – remain overbought for far longer than they can remain oversold, we are mindful of the extremes to which some corners of the equity market have traded. Even if those upside trends are and remain intact, the prudent investor will be wise to maintain some exposure to safe harbor names which may help to mitigate a portfolio from sudden changes in tone and direction.
A Technical Perspective
Volatility
Decreasing volatility is a “bull” market characteristic. Most new market highs occur on low or decreasing volatility. Low volatility is a sign that the market is trading efficiently, and not trading on a high degree of emotion.
But volatility can get too low. Currently, our Canterbury Volatility Index (CVI) for the S&P 500 measures CVI 55. Our studies show that when volatility drops below a Canterbury Volatility Index reading of CVI 50, the markets are prone to experience an “outlier” day. An outlier day is defined as any trading day that exceeds +/-1.50%. That number of +/-1.50% is based on bell curve math.
When the market is stable or is trading “efficiently”, investors should expect to see between 10 and 20 outlier days over the course of a year. So far in 2024, there have only been two outlier days. As we approach extreme low volatility, statistically speaking, the market could be due to see an outlier day or two.
Often, during normal market conditions, market fluctuations typically will go back to normal following an outlier day. The outlier day relieves some “pent-up” pressure caused by squeezed down volatility. If outlier days continue to occur, in clusters, it could be a cause for concern of rising volatility. None of that has occurred yet.
Overbought Markets
When looking at the short-term, markets are not quite “overbought” or overextended (according to the technical RSI indicator). Overbought conditions occur when the markets have moved too far over a short period. However, when we look at weekly data, markets have been overbought for several weeks. The S&P 500 has registered overbought conditions for the last 11 consecutive weeks. This is the longest weekly streak since January 2018.
Quite a few individual sectors are also overbought. Communications has seen overbought conditions for 12 straight weeks (a record); Financials has been overbought for 11 weeks; Industrials has been overbought for 8 weeks; and Energy just registered its first weekly overbought condition since May ’22.
Based on what you just read, it should be apparent that overbought conditions can stay in place for a while. Eventually, however, they will come to an end. Given the our statement on volatility, could a potential outlier day relieve overbought conditions?
Consumer Discretionary
Looking at a chart for the Consumer Discretionary sector, nothing appears to be alarming on the surface. The sector appears to have an orderly pattern, but appearances can be deceptive. Sectors are cap-weighted averages of their components (larger company stocks are given more weight). When we look “under the hood” of the Consumer Discretionary sector, there are some concerns.
To keep things simple, in 2024, the Consumer Discretionary sector is up about +1% (through Friday, April 5th). Amazon is the sector’s largest component, representing 25% of the sector’s capitalization. This means that Amazon accounts for 25% of the sector’s daily performance.
Year-to-date, Amazon is up 21.80% on the year (through Friday, April 5th). That stock represents a quarter of the sector, so how would the sector only be up 1%? Well, the sector’s other large components aren’t doing as well.
This year, Tesla (12% of Consumer Discretionary sector) is down -33%; Home Depot (9% of sector) is up 3% but has fallen -9% in the last 10 days; and McDonalds (4% of sector) is down -10%.
Bottom line, Amazon appears to be what is keeping the sector afloat. The largest nine Consumer Discretionary stocks make up 67% of the sector and are down -4% on average this year. Remove Amazon from that equation, and those 8 stocks are down -7% on average this year.
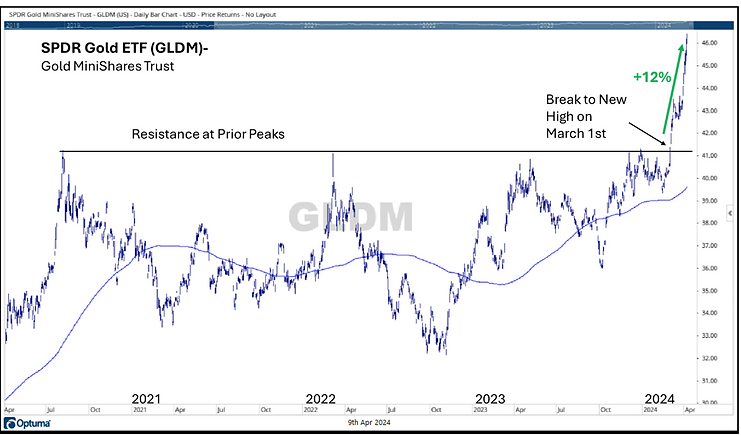
Chart of the Week- Gold
Since breaking out to a new high, Gold has taken off like a rocket, rising +12% since March 1st. This is a security that had moved sideways since July 2020.
It is interesting that Gold is typically viewed as a hedge against inflation. Inflation seemed to be at its worst when rates were rising in 2022, yet that was also when Gold was at its worst, experiencing a -20% peak-to-trough decline that year. It goes to show you that asset classes don’t always correlate with conventional wisdom.
Today, the rise in Gold could now be correlated to the inflation and interest rate discussions. In late 2023, there were talks of rate cuts in 2024. Now, that sentiment has started to shift as investors begin to question if those cuts will come this year. While Gold has taken off, bonds (which are interest rate sensitive) are in a downtrend. Whatever the reason for Gold’s rise, at the end of the day, Demand is exceeding Supply. As the saying goes, “the trend is your friend.” Source Brandon Bischoff
The Week Ahead
Attention shifts this week to the U.S. CPI report on Wednesday. Inflation rates are still well above the Fed’s 2% target, and forecasts suggest that consumer prices rose 3.5% YoY in March, up from 3.2%.
Barring a surprise dip, the odds of a rate cut happening in June or possibly even July are likely to fade further. Minutes from the March FOMC meeting will also be released Wednesday, but there may not be much to glean given that Chair Powell and other committee members have expressed their views
in public forums since then. Both the 10- and 30-year Treasury yields reached new 2024 highs last week, and fresh auctions on Wednesday and Thursday will gauge the market’s appetite for additional supply. Earnings season gets underway on Friday with reports from the large U.S. banks—JP Morgan Chase, Wells Fargo, and Citigroup. Other U.S. data of note include March PPI and preliminary consumer sentiment for April. The international calendar features central bank decisions from Canada and Europe. Interest rate markets are assigning a high probability to a June ECB cut, so investors will be looking for any indications in the statement supporting that timeline. Eurozone data due this week includes today’s consumer confidence and German industrial production numbers. The UK releases monthly GDP figures on Friday. Last of all, China will publish an inflation update midweek, followed by trade data likely boosted by positive seasonal momentum.
This article is provided by Gene Witt of FourStar Wealth Advisors, LLC (“FourStar” or the “Firm”) for general informational purposes only. This information is not considered to be an offer to buy or sell any securities or investments. Investing involves the risk of loss and investors should be prepared to bear potential losses. Investments should only be made after thorough review with your investment advisor, considering all factors including personal goals, needs and risk tolerance. FourStar is a SEC registered investment adviser that maintains a principal place of business in the State of Illinois. The Firm may only transact business in those states in which it is notice filed or qualifies for a corresponding exemption from such requirements. For information about FourStar’s registration status and business operations, please consult the Firm’s Form ADV disclosure documents, the most recent versions of which are available on the SEC’s Investment Adviser Public Disclosure website at www.adviserinfo.sec.gov/
The Optimized Investor
